The widespread severe weather episode at the beginning of the week of April 3, 2011, resulted in over 1000 individual reports of thunderstorm wind gusts that either produced damage, or were of such magnitude that the observed wind speed was capable of producing damage. One definition the National Weather Service (NWS) uses to categorize a severe thunderstorm is: any thunderstorm producing a wind gust equal to or greater than 50 knots (58 mph), or observed wind damage resulting from estimated wind speeds equal to or greater than 50 knots (58 mph).
A truly remarkable number of wind events did occur in this recent event. In fact, while the number of wind reports across a 24 hour period remain preliminary and will need to be further reviewed by NWS meteorologists in the affected areas, it is likely that in the final analysis, the wind reports numbers alone will far exceed any other severe weather outbreak in the official records of the NWS. However, using wind reports alone can be misleading when attempting to put an event such as this into some meteorological and historical perspective.
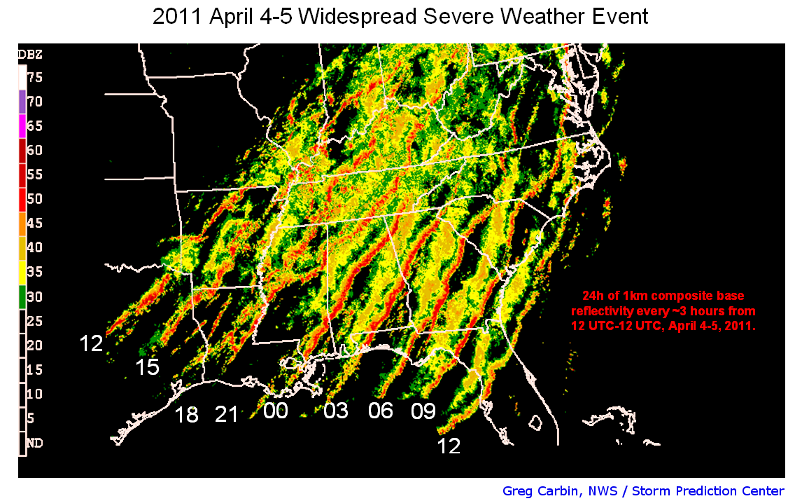
The image above is a composite of 24 hours of base reflectivity data, taken approximately every three hours, to show the evolution of the squall line across the southern United States. The line traveled more than 800 miles in about 24 hours with an average speed of something between 30-40 mph. Clearly, surface wind speeds within the intense segments of the line must have been blowing harder to produce such a huge number of reports. However, there have been other recent examples of intense linear convection (squall lines), some moving across this same region of the country, with faster overall system motions.
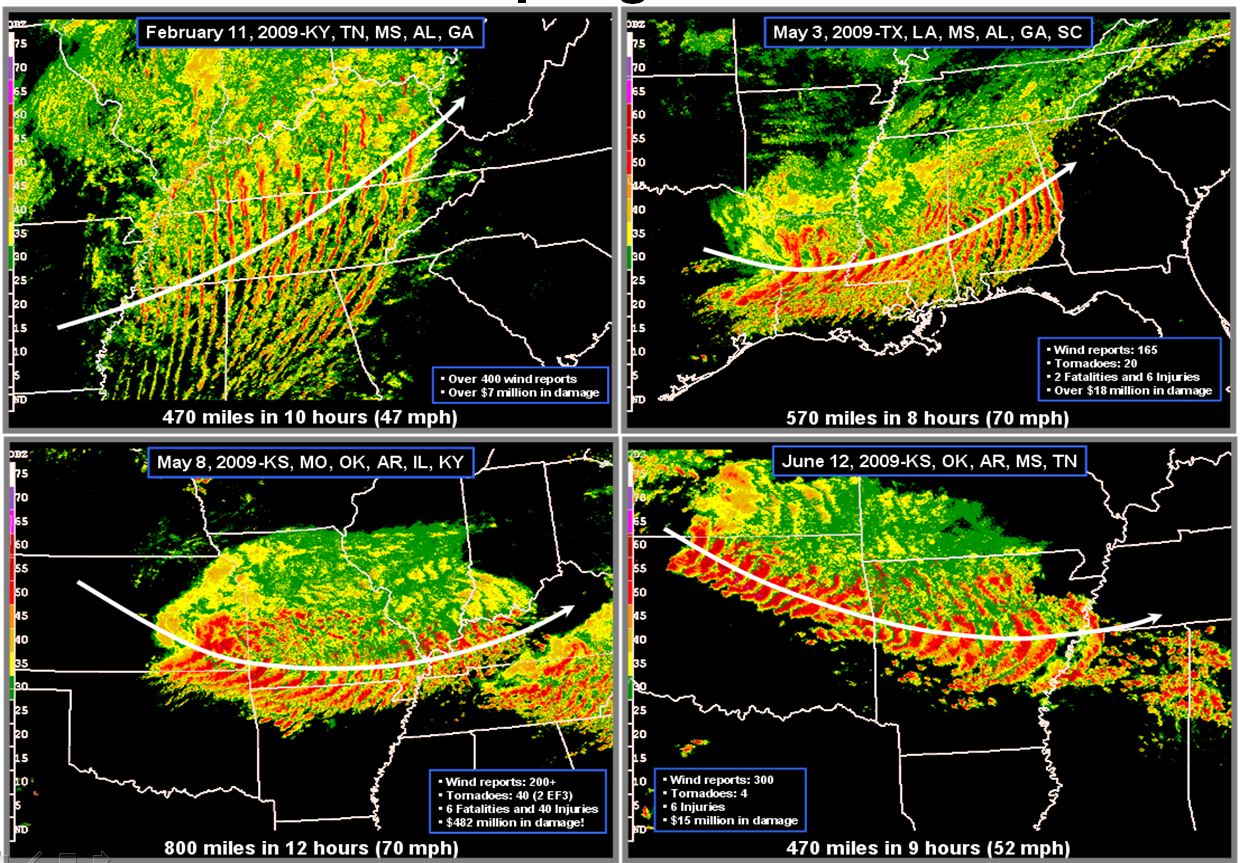
At left are composites of four damaging wind events from 2009 that had overall system speeds greater than this most recent event. One big difference in these events, when compared with April 4-5, 2011, is that the linear extent of the squall line was more compact. The May 3, 2009 event covered 570 miles in eight hours at an average speed of more than 70 mph and only produced about 165 wind reports. Arguably, this was a more intense and faster-moving squall line than what occurred on April 4-5, 2011, but it was concentrated over a much smaller area.
Probably the one event of the four depicted from 2009 that comes closest in terms of areal extent to the recent outbreak is the February 11, 2009 squall line (upper left). This event produced more than 400 reports and traveled at an estimated forward speed approaching 50 mph. Even with a greater forward speed across some of the same general area of the country as the event on April 4-5, 2011, the total number of wind reports was less than half of those recently reported. This event, coming during the winter months, was in an environment characterized by generally weak instability but incredibly potent dynamics.
These examples serve to illustrate the point that severe weather episodes come in all shapes and sizes and, combined with secular trends in severe weather reporting, increasing population density, and information technologies allowing the rapid transmission of observations, make characterizing these events and placing them in historical perspective very difficult. April 4-5, 2011 was a very “big day” in terms of reports and squall line extent. But, how big a day was it when compared to other “big days”?
The greatest single-day annual wind event totals, for each year since 2005, are summarized in the table below.
| Date => | 6-Jun-05 | 2-Apr-06 | 19-Jun-07 | 11-Jun-08 | 11-Feb-09 | 5-Aug-10 | 4-Apr-11 |
|---|---|---|---|---|---|---|---|
| Wind Reports/Sig | 350/13 | 455/38 | 358/15 | 432/10 | 375/16 | 447/11 | 1160/6 |
| Total Watches | 13 | 19 | 11 | 6 | 6 | 5 | 16 |
| Fatalities* | 0 | 28 | 1 | 6 | 1 | 1 | ~8 |
| Injuries* | 1 | 357 | 3 | 53 | 1 | 15 | ~2 |
| Warnings | 1014** | 1412** | 711** | 659 | 311 | 463 | 568 |
| *includes tornado | |||||||
| **county-based | |||||||
The greatest values for any of the event characteristics are highlighted in red font. Please note the numbers for this most recent event remain preliminary, as already mentioned above. While the April 2-3, 2006 event had fewer than 50% of the wind reports of the 2011 event, it ended up with considerably more “significant” wind observations. The Storm Prediction Center (SPC) considers “significant wind” as any gust of 65 knots (75 mph) or greater. The 2006 event, coming at nearly the same time of year, had 38 thunderstorm wind gusts in excess of hurricane force. And, despite encompassing a more concentrated area of the Midwest, this outbreak required the issuance of three more watches from the SPC, and had a lot more warnings associated with it. Most of the fatalities that occurred in April 2006 were associated with tornadoes, not straight-line winds. The injuries from this event far exceed those reported so far for the most recent event.
There are other methods one could use for some of these recent events, including looking at the relatively dense automated observational network where thunderstorms and wind gusts are observed. Given the 1000+ wind reports from April 4-5, 2011 over such an expansive area, one would think several airport observations would record wind gusts in excess of 50 knots, along with thunder. A preliminary investigation into this question shows a total of less than 10 observations had thunder and wind gusts observed at or above 50 knots. There are only three observations on any hour in the 24 hour period that meet severe thunderstorm criteria (thunder with wind gust equal to or greater than 50 knots). When intra-hour special observations are included in this analysis, there are only three additional thunderstorm “PEAK WIND” gusts of 50 knots or greater that can be added to the total. The ratio of thunderstorm observations, to thunderstorm observations with gusts meeting severe criteria (>= 50 knots), and to overall wind damage reports, is another aspect of “big wind” outbreaks that can be used to measure their characteristics and place them into better meteorological perspective. This particular investigation is very preliminary and any additional information on this approach may be released here on the U.S. Severe Weather Blog.
Ultimately, the most important aspect of these events from an NWS and SPC perspective is that we get the word out to the public that trouble is on the way. The map below shows the extensive nature of the NWS watches and warnings issued on April 4-5, 2001.


