Certainty, doubt, and verification

Today’s forecast on CI focused on the area from northeast KS southwest along a front down towards the TX-OK panhandles. It was straightforward enough. How far southwest will the cap break? Will there be enough moisture in the warm sector near the frontal convergence? Will the dryline serve as a focus for CI, given the development of a dry slot present just ahead of the dryline along the southern extent of the front and a transition zone (reduced moisture zone)?

So we went to work mining the members of the ensemble, scrutinizing the deterministic models for surface moisture evolution, examining the convergence fields, and looking at ensemble soundings. The conclusion from the morning was two moderate risk areas: one in northeast KS and another covering the triple point, dryline, and cold front. The afternoon forecast backed off the dryline-triple point given the observed dry slot and the dry sounding from LMN at 1800 UTC.

The other issue was that the dryline area was so dry and the PBL so deep that convective temperature would be reached but with minimal CAPE (10-50 J kg-1). The dry LMN sounding was assumed to be representative of the larger mesoscale environment. This was wrong, as the 00 UTC sounding at LMN indicated an increase in moisture by 6 g/kg aloft and 3 at the surface.

Another aspect to this case was our scrutiny of the boundary layer and the presence of open-cell convection and horizontal convective rolls. We discussed, again, that at 4km grid spacing we are close to resolving these types of features. We are close because of the scale of the rolls (in order to resolve them they need to be larger than 7times the grid spacing) which scales with the boundary layer depth. So a day like today where the PBL is deep, the rolls should be close to resolvable. On the other hand, there is a need for additional diffusion in light wind conditions and when this does not happen, the scale of the rolls collapses to the scale of the grid. In order to believe the model we must take these considerations into account. In order to discount the model, we are unsure what to look for besides indications of “noise” (e.g. features barely resolved on the grid, scales of the rolls being close to 5 times the grid spacing).

The HCRs were present today as per this image from Wichita:

ict_110608_roll

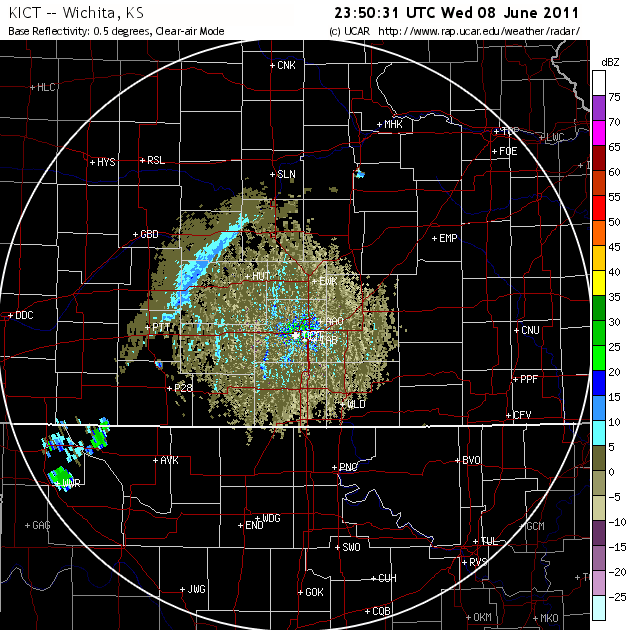
However, just because HCRs were present does not mean I can prove they were instrumental in CI. So when we saw the forecast today for HCRs along the front, and storms developed subsequently, we had some potential evidence. Given the distance from the radar, it may be difficult if not impossible, to prove that HCRs intersected the front, and contributed to CI.

This brings up another major point: In order to really know what happened today we need a lot of observational data. Major field project data. Not just surface data, but soundings, profilers, and low level radar data. On the scale of The Thunderstorm Project, only for numerical weather prediction. How else can we say with any certainty that the features we were using to make our forecast were present and contributing to CI? This is the scope of data collection we would require for months in order to get a sufficient amount of cases to verify the models (state variables and processes such as HCRs). Truly an expensive undertaking, yet one where a number of people could benefit from one data set and the field of NWP could improve tremendously. And lets not forget about forecasters who could benefit from having better models, better understanding, and better tools to help them.

I will update the blog after we verify this case tomorrow morning.

Wrong but verifiable

The fine resolution guidance we are analyzing can get the forecast wrong yet probabilistically verify. It may seem strange but the models do not have to be perfect, they just have to be smooth enough (tuned, bias corrected) to be reliable. The smoothing is done on purpose to account for the fact that the discretized equations can not resolve more than 5-7 times the grid spacing. It is also done because the models have little skill below 10-14 times the grid spacing. As has been explained to me, this is approximately the scale at which the forecasts become statistically reliable. An example forecast of a 10 percent probability, in the reliable sense, will verify 10 percent of the time.

This makes competing with the model tough unless we have skill at deriving not only similar probabilities, but placing those probabilities in close proximity in space-time relative to observations. Re-wording this statement: Draw the radar at forecast hour X probabilistically. If you draw those probabilities to cover a large area you wont necessarily verify. But if you know the number of storms, their intensity, their longevity, and place them close to what was observed you can verify as well as the models. Which means, humans can be just as wrong but still verify their forecast well.

Let us think through drawing the radar. This is exactly what we are trying to do, in a limited sense, in the HWT for the Convection Initiation and Severe Storms Desks over 3 hour periods. The trick is the 3 hour period over which the models and forecasters can effectively smooth their forecasts. We isolate the areas of interest, and try to use the best forecast guidance to come up with a mental model of what is possible and probable. We try to add detail to that area by increasing the probabilities in some areas and removing some for other areas.  But we still feel we are ignoring certain details. In CI, we feel like we should be trying to capture episodes. An episode is where CI occurs in close proximity to other CI in a certain time frame presumable because of a similar physical mechanism.

By doing this we are essentially trying to provide context and perspective but also a sense of understanding and anticipation. By knowing the mechanism we hope to either look for that mechanism or symptoms of that mechanism in observations in the hopes of anticipating CI. We also hope to be able to identify failure modes.

In speaking with forecasters for the last few weeks, there is a general feeling that it is very difficult to both accept and reject the model guidance. The models don’t have to be perfect in individual fields (correct values or low RMS error) but rather just need to be relatively correct (errors can cancel). How can we realistically predict model success or model failure? Can we predict when forecasters will get this assessment incorrect?

Timing

It is remarkably difficult to predict convection initiation. It appears we can predict, most times (see yesterdays post for a failure), the area under consideration. We have attempted to pick the time period, in 3 hour windows, and have been met with some interesting successes and failures. Today had 2 such examples.

We predicted a time window from 16-19 UTC along the North Carolina/South Carolina/ Tennessee area for terrain induced convection and along the sea breeze front. The terrain induced storms went up around 18 UTC, nearly 2 hours after the model was generating storms. The sea breeze did not initiate storms, but further inland in central South Carolina there was one lone storm.

The other area was in South Dakota/North Dakota/Nebraska for storms long the cold front and dryline. We picked a window between 21-00 UTC. It appears storms initiated right around 00 UTC in South Dakota but little activity in North Dakota as the dryline surged into our risk area.  Again the suite of models had suggested quick initiation starting in the 21-22 UTC time frame, including the update models.

In both cases we could isolate the areas reasonably well. We even understood the mechanisms by which convection would initiate, including the dryline, the transition zone, and the where the edge of the deeper moisture resided in the Dakotas. For the Carolinas we knew the terrain would be a favored location for elevated heating in the moist air mass along a weak, old frontal zone. We knew the sea breeze could be weak in terms of convergence, and we knew that only a few storms would  potentially develop. What we could not adequately do, was predict the timing of the lid removal associated with the forcing mechanisms.

It is often observed in soundings that the lid is removed via surface heating and moistening, via cooling aloft, or both processes. It is also reasonable to suspect that low level lifting could be aiding in cooling aloft (as opposed to cold advection). Without observations along such boundaries it is difficult to know what exactly is happening along them, or even to infer that our models correctly depict the process by which the lid is overcome. We have been looking at the ensemble of physics members which vary the boundary layer scheme, but today was the first day we attempted to use them in the forecast process.

It was successful in terms of incorporating them, but as far as achieving understanding, that will have to come later. It is clear that understanding the various structures we see, and relating them to the times of storm initiations will be a worthwhile effort. Whether this will be helpful to forecasting, even in hindsight, is still unknown.

When too much is not enough

Going into HWT today, I was thinking about and hoping for a straightforward (e.g. easy) forecast for storms. I was hoping for one clean slate area. An area where previous storms would not be an issue, where storms would take their time forming, and where the storms that do form would be at least partially predicted by the suite of model guidance we have at our disposal. Last time I think that.

The issues for today were not particularly difficult, just complex. The ensemble that we work with was doing its job, but the relatively weak forcing for ascent in an unstable environment was leading to convection initiation early and often. The resulting convection produced outflow boundaries that triggered more convection. This area of convection was across NM, CO, KS, and NE. It became difficult to rely on these forecasts because of all of this convection in order to make subsequent forecasts of what might occur this evening in NE/SD/IA along the presumed location of a warm front.

We ended up trying to sum up not only the persistent signals from the ensemble, but also every single deterministic model we could get our hands on. We even used all the 12 UTC NAM, 15 UTC SREF, RUC, HRRR, NASA WRF, NSSL WRF, NCAR WRF, etc. We could find significant differences with observations from all of these forecast models (not exactly a rare occurrence) which justified putting little weight on the details and attempting to figure out, via pattern recognition, what could happen. We were not very confident in the end, knowing that no matter what we forecast or when, we were destined to bust.

Ensemble wise, they did their job in providing spread, but it was still somehow not enough. Perhaps it was not the right kind or the right amount of spread. We will find out tomorrow how well (or poorly) we did on this quite challenging forecast. In the end though, we had so much data to digest and process, that the information we were trying to extract became muddied. Without clear signals from the ensemble, how does a forecaster extract the information and process that into a scenario? Furthermore, how can the forecaster apply that scenario to the current observations to assess if that scenario is plausible?

I will leave you with the current radar and ask quite simply: What will the radar look like in 3 hours?

displayN0R

UPDATE: Here is what the radar looked like 3 hours later:

Nothing like our forecast for new storms. But that is the challenge when you are making forecasts like these.

Tags:

Quick Post

I have blogged here about scales of CI but this weekend was a great example.
Saturday:

tlx

These storms formed in close proximity to the dryline where the southern most supercell went up pretty quickly and the other to the North and West went up much slower, remained small and then only the closest storm to the supercell formed into one. But the contrast is obvious. Even after breaking the cap, the storms remained small for an hour or so, and a few remained small for 2.

Today, we saw turkey towers along the dryline for quite a while (2 hours-ish) in OK and then everything went up. But it is interesting to see the different scales, even at the “cloud scale” where things tend be uneven and random, skinny and wide, slow and fast. It makes you wonder what the atmospheric structure is, especially when our tools tell us the atmosphere is uncapped, but the storms just don’t explode.

Looks like a pretty active southern Plains week is just beginning, as evidenced by the 43 tornado reports today and the 20 yesterday.

Tags: