AzShear Effectively Detects Anticyclonic Rotation

Two supercells southwest of Lubbock produced perplexing base radar signatures with a clear right-mover reflectivity signature but anticyclonic rotation evident in storm-relative velocity. To its credit, the MRMS AzShear product picked up on the anticyclonic circulation effectively and should be able to detect the rare anticyclonic tornado!

None of the mesocyclone detection algorithms picked up on the anticyclonic rotation. Perhaps this is part of their design. The New MDA tried to detect a mesocyclone southeast of the main anticyclonic circulation on the gradient of the strong outbound velocities, but it is incorrect.

-Atlanta Braves

NUCAPS Procedures Usefulness

The NUCAPS Quick  Guide from JPSS includes a few procedures. Here I show the utility of a few of those procedures for combining GOES Satellite data and NUCAPS data.

This procedure plots 400-200mb relative humidity and GOES-16 water vapor. You can see the representation of the dry air across the northern US and the systems in the Plains & southeast.

Another procedure compares GFS, HRRR, and NAM lapse rates with the NUCAPS lapse rate info. This is a good check to see if model lapse rates are performing well or where they need to be taken with a grain of salt.

Another procedure plots 850-300mb RH and low-level water vapor. The product shows the system in the Plains and the system in the Ohio Valley. Drying is also obvious in the southern Great Lake and North Dakota.

I like the procedures provided in the JPSS Quick Guide. I am starting to understand the applicability of the NUCAPS data little bit more. These procedures are helpful in contextualizing the provided data fields.

-Atlanta Braves

Comparing NUCAPS Modified Soundings and 18Z RAOBs

A satellite pass at around 19Z allowed us to compare NUCAPS modified soundings with 18Z RAOBs. A comparison of a NUCAPS sounding near Amarillo seemed to reasonably represent the mid and upper levels with the 18Z KAMA RAOB. The NUCAPS sounding had slightly lower freezing level and -20C and -30C heights compared with the RAOB (10.9, 19.0, and 23.2 kft vs 12.2, 20.8, and 25.4 kft, respectively). The midlevel lapse rates were comparable at around 8.0 C/km. However, the NUCAPS sounding appeared to struggle with the lower levels, not representing the subsidence inversion evident on the RAOB, and being too cool and dry at the surface (T/Td of 20/17C on the NUCAPS compared with 24/19C on the RAOB). This led to lower CAPE estimates from the NUCAPS than were observed by the RAOB.

Similar results were seen in a comparison of the 18z KLMN RAOB with a NUCAPS Modified sounding near Lamont, OK:

Ron Dayne

AllSky as a good proxy for dryline location and CI

The AllSky Layer Precipitable  Water product showed utility in identifying and tracking the dryline as it moved into the Lubbock CWA. The dryline entered the CWA at about 1930 UTC.

Coincidentally, the KLBB radar shows convection initiation around 19:30 UTC as well.

And the convection continues to develop:

The AllSky product remains a very useful tool for situational awareness and 2-D environmental familiarization.

-Atlanta Braves

Comparisons of NUCAPS and Model Data Lapse Rates…

So, it can be refreshing to see when NUCAPS data agree with model data, but I’m often more interested in those cases where there are differences, and potentially important differences.  Notice in the images below the comparisons between NUCAPS 850-500 mb lapse rates and various model data.

Image 1. 850-500 mb lapse rates from NUCAPS (upper left), HRRR (upper right), GFS (lower left), and NAM40 (lower right), valid ~18 UTC 23 May 2019

Notice the relatively large differences that stretch SW to NE from central W VA into New England.  Taking a look at nearby radar imagery, it’s clear why this area had significantly lower lapse rate values in the NUCAPS data than the models; a line of showers and thunderstorms were present along this path of lower values that was displayed in the NUCAPS gridded data (Image 2).

Image 2.  850-500 mb lapse rates from NUCAPS (upper left), HRRR (upper right), GFS (lower left), and NAM40 (lower right), along with 0.5 Refl from the KCCX radar, valid ~18 UTC 23 May 2019

Of course, the NUCAPS retrievals certainly would have been affected by this area of denser clouds and precipitation.  Nevertheless, lapse rates would be affected (lowered) by the convection in those locations, which is depicted in the NUCAPS data only.  So, the lack of this feature in the models would then affect their forecast in this region going forward.  It will be interesting to see the NUCAP-Forecast data in this type of scenario.  In fact, one of the forecasters here is taking a look.  Anyway, let’s imagine a scenario where this convection had dissipated and left behind a boundary or gradient in temperature/moisture.  The detection of these types of boundaries, that often occur in pulse type convective events especially, can be important for predicting where convection will take place subsequently.

Oh…one more thing, it was interesting to notice the quick air mass recovery and advection of steep lapse rates and instability behind the area of convection in the OH Valley.  So, given ample forcing, further convective development is possible even behind this line.  In fact, the NUCAPS indicates lapse rates ~7 C/km across a broad area on the edge of the swath in the OH Valley.

-Kris W

Prob Severe Very Helpful Today

The Prob Severe Product has been very good for guidance today. See an example below.

Notice I have used an alternative color scale for the Prob Severe, but every cell with a Prob Severe of 80%+ (in black) was placed under some kind of warning. The prob severe was not the only tool used in the warning decision making process (as usual), but it was very effective in confirming the decision process using the base data.

Thorcaster

GLM flash rate, size, and RGB with IR

GLM IR, FED, and MFA loop
Loop on 22 May 2019, 21:36-22:06 UTC, showing a combined view of ABI Ch 1610.3 micron IR and GLM minimum flash area and flash extent density (top left). Other panels show the individual channels that contribute: FED (red), AFA (green) and IR (blue)

This pair of supercells near Tulsa, OK illustrates how flash rate and flash area information can complement one another. High flash rates and small flashes usually go together in a small updraft. However, at 2145 UTC the flash rate is much higher in the southern storm at the same time its minimum flash size is larger, with the opposite pattern in the northern storm. The northern storm was tornadic at this time. Shortly thereafter, the large flash rates decreased in the southern cell, and the average flash size became smaller, while cloud top brightness temperatures rapidly cooled and the extent of the anvil spread. The southern cell would soon go on to produce its own tornado.

The RGB panel in the top left combines the flash information together with the ABI 10.3 thermal infrared data: the coldest cloud tops and small flashes lead to a bright cyan color, and high flash rates push the colors further toward white. Early on the northern cell exhibits cyan colors while the southern cell is green and burgundy. Later, the southern cell becomes more cyan, while the northern cell takes on a more green hue.

Apparently, the jump in flash rate in the southern cell was an indicator of a strengthening updraft and the development of a mesocyclone. The drop in flash rate and minimum flash size might have been due to (1) a shift to small flashes that didn’t make as much light, (2) extinction of light by an increasingly ice-rich, optically thick cloud, or (3) other instrument artifacts. While the explanation is less than clear-cut, synthesis of multiple sources of information improves the ability to understand the observations.

-deeplycloudy

AzShear and CPTI helping to lead to tornado warning decision

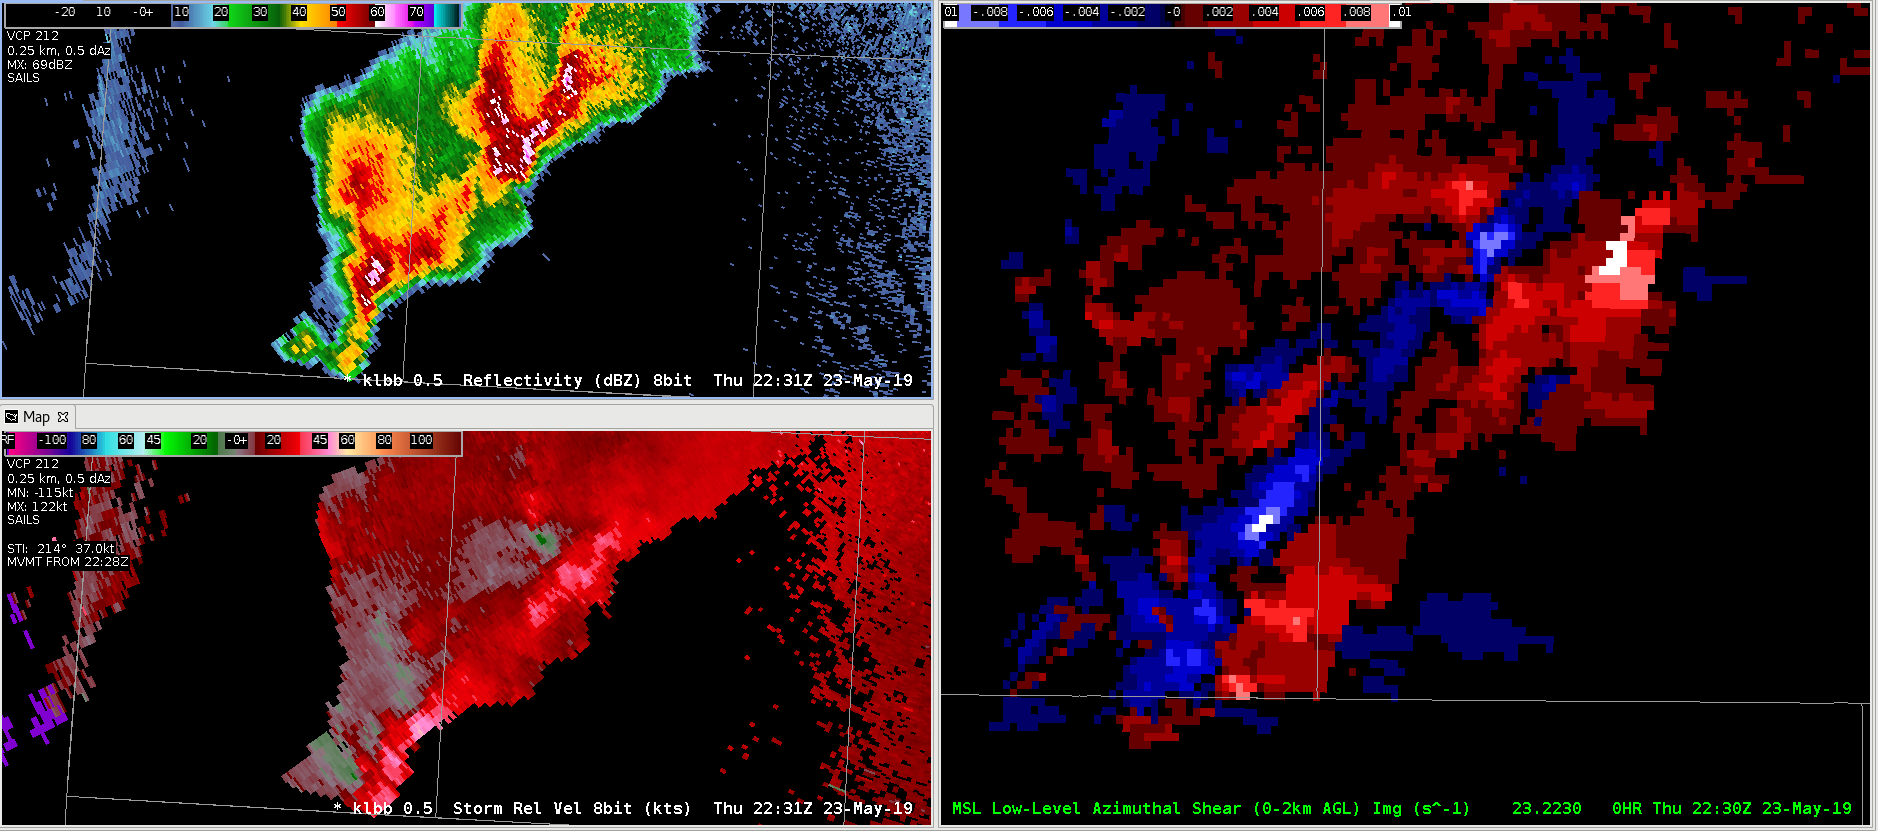
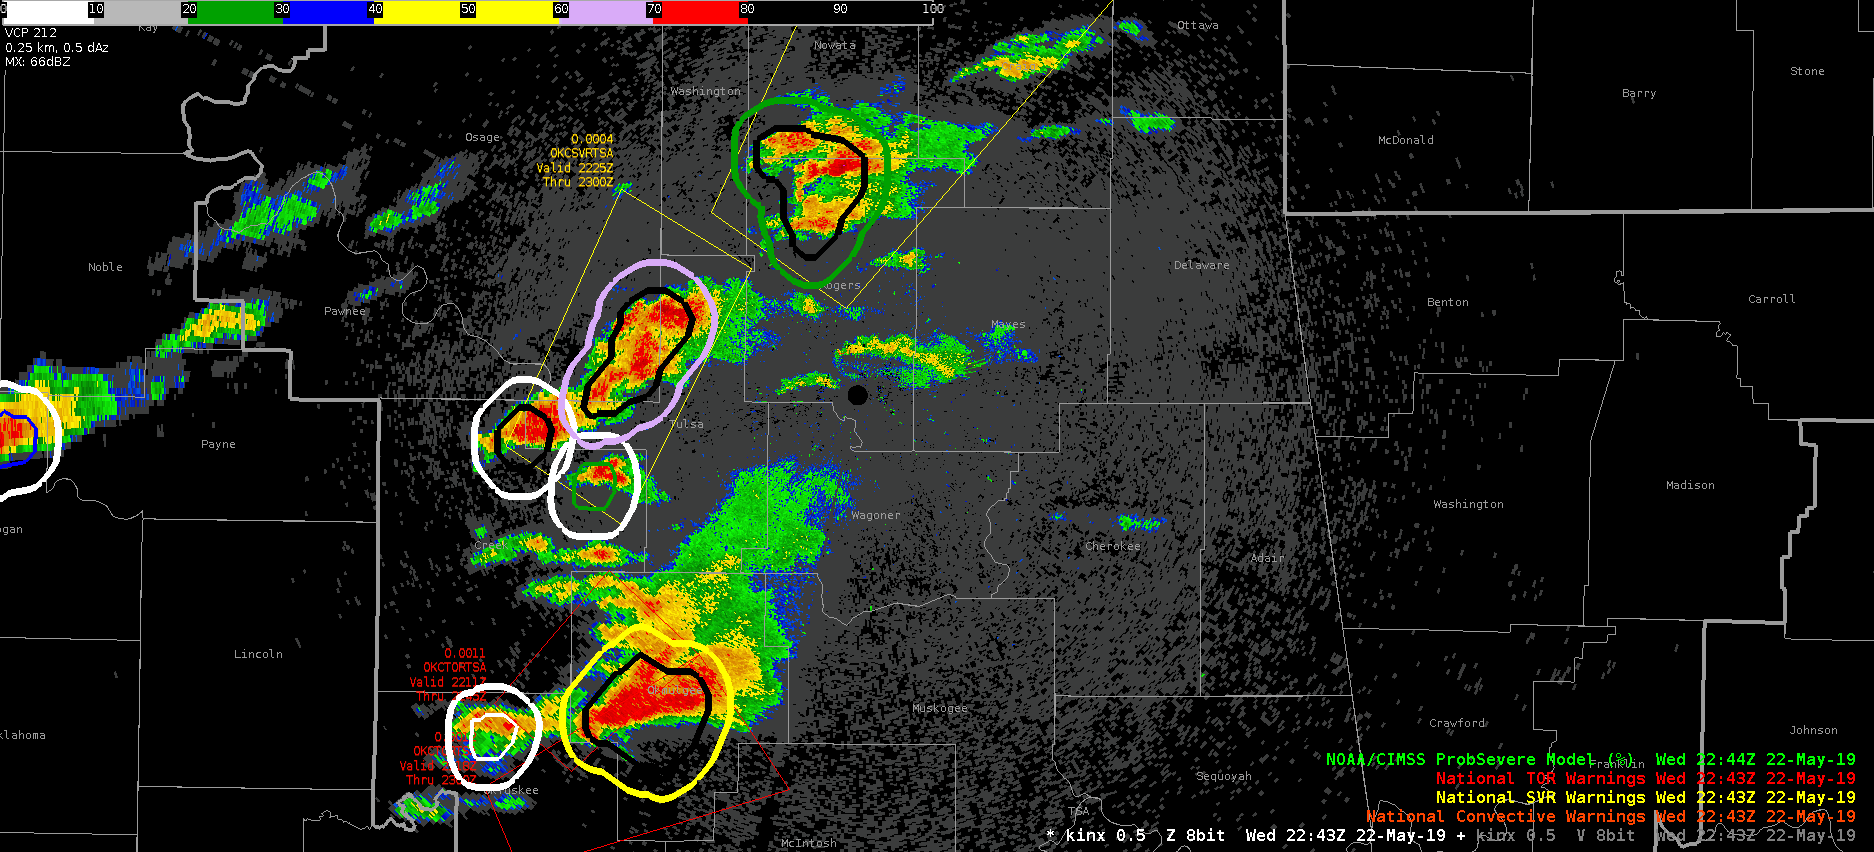
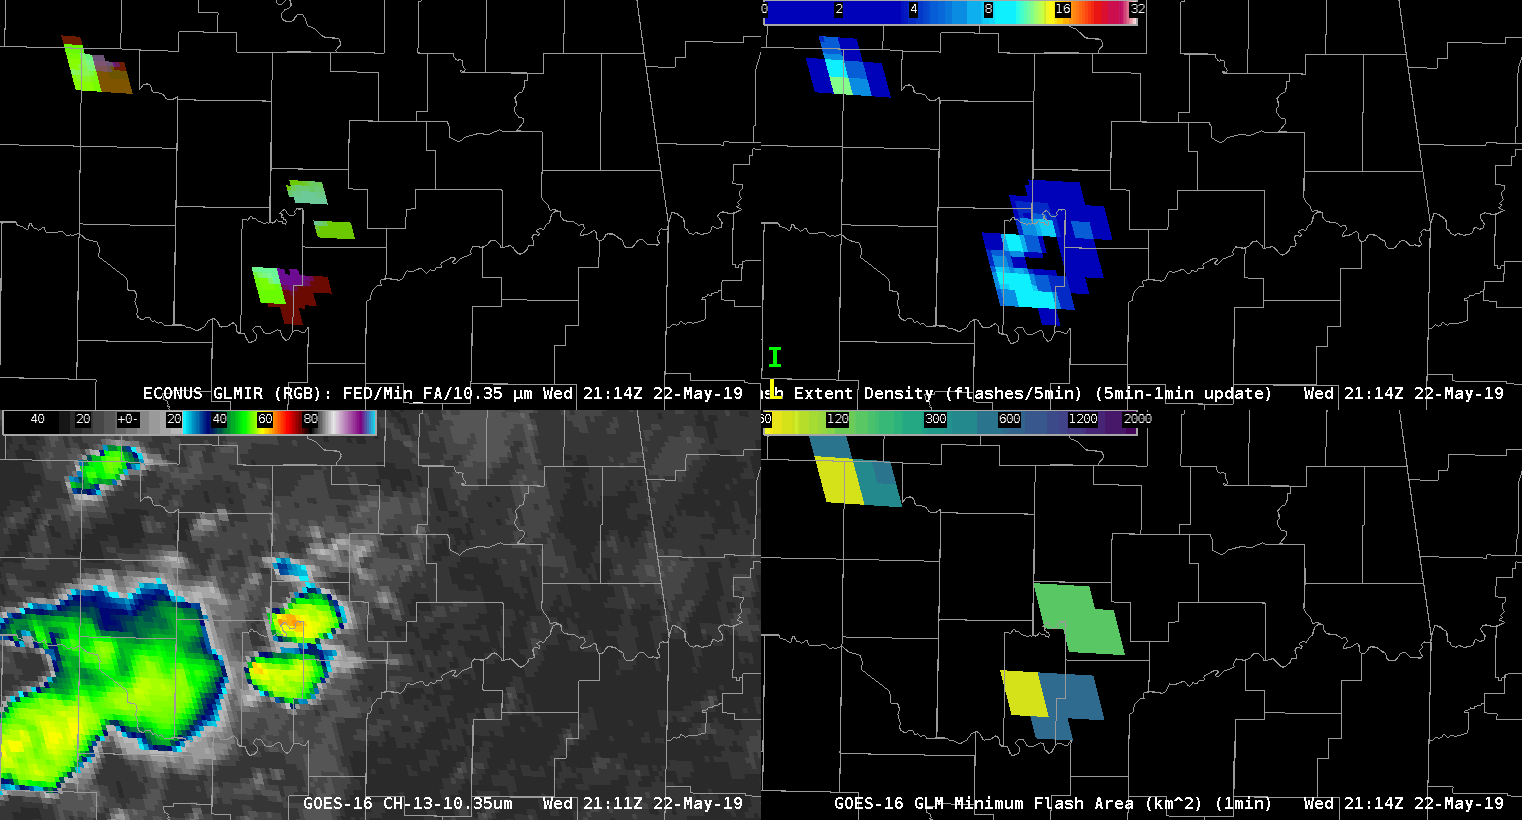
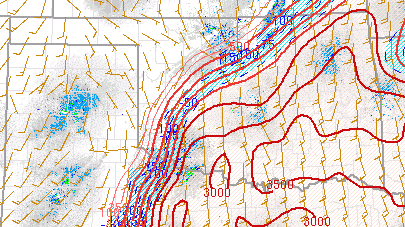
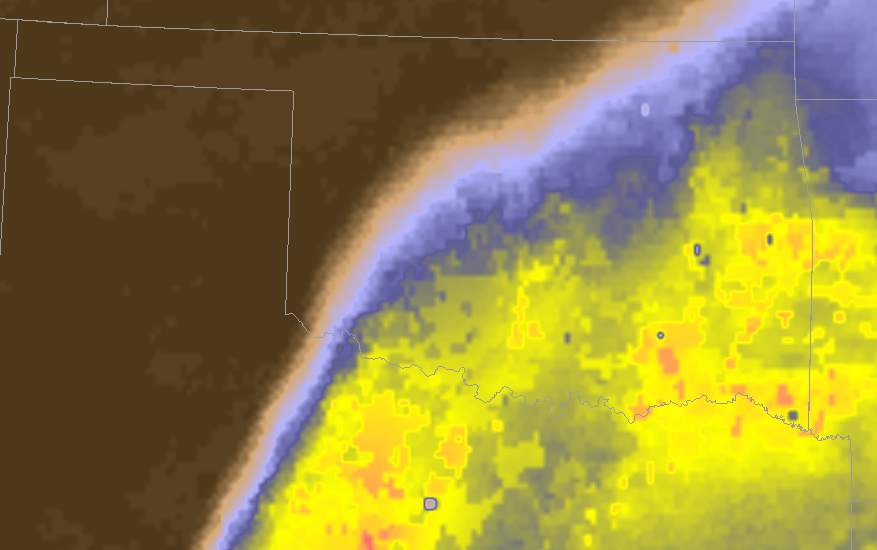
On May 22 at around 2130Z, a tornado warning (test) was issued for Okfuskee County in the Tulsa CWA. Besides the usual examination of base velocity data, other tools that were used to help the decision were the merged AzShear products and the CPTI products. Watch the loop below.

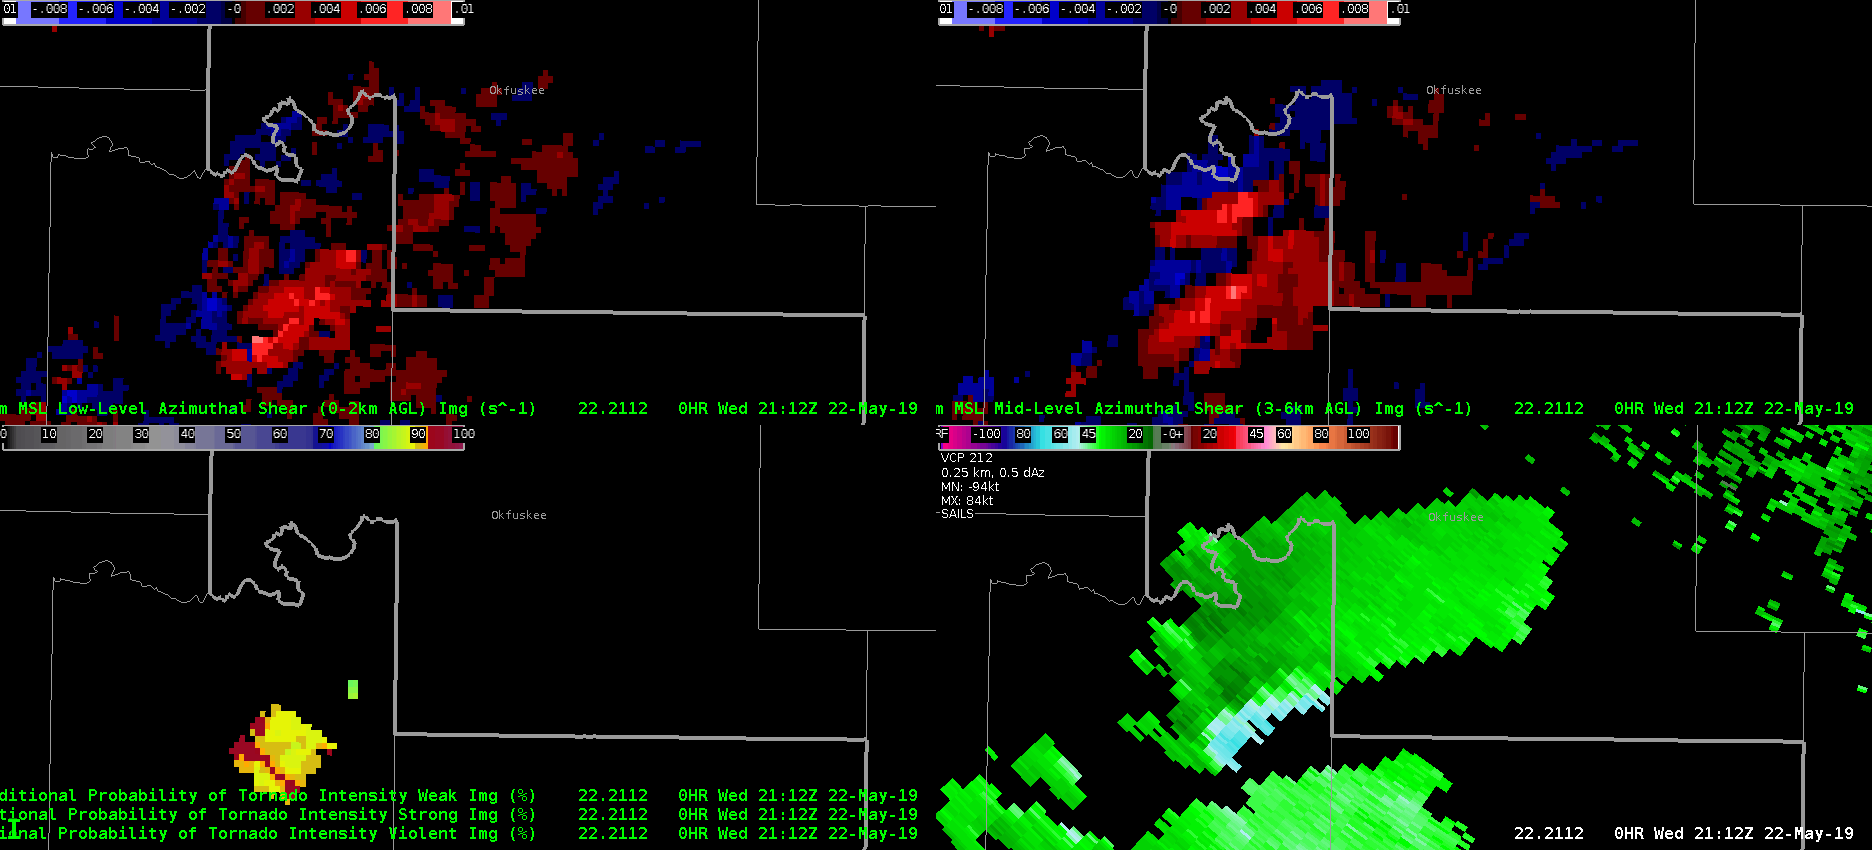
In this four-panel, the upper left has the 0-2 km merged AzShear, the upper right has the 3-6 km AzShear, the lower left has the Weak/Strong/Violent CPTI products overlayed on each other, and the lower right has the 0.5 degree base velocity.

At the beginning of the loop, the max 0-2 km AzShear values were .008 s^-1, but increased throughout the loop, eventually reaching  .012 s^-1, exceeding the .010 threshold. The 3-6 km AzShear showed a similar trend.

The CPTI product showed a noticeable trend as well. At the beginning of the loop the weak/strong/violent values were 89/11/0 %, respectively. Since most every value of AzShear starts with 100% weak, the values were not overly supportive. However, by the end of the loop, the values were 75/23/2 % respectively, a significant increase in the threat of both strong and violent tornadoes. With the limited experience I have using the product, once the strong gets to 20% or higher, and the violent gets to 2% or higher, it greatly increases the confidence in needing a tornado warning.

Thorcaster

Comparison of NUCAPS modified and unmodified soundings at 19Z on 5/22

This post is going to compare the significant differences between the modified and unmodified NUCAPS sounding near Tulsa, OK at 19Z on May 22.

First a look at the unmodified sounding.  It actually shows a small temperature inversion near the surface in the boundary layer, with a surface temperature of 75, and a surface dew point of 61. This resulted in a computed surface-based CAPE of 362 J/kg, and a mixed layer CAPE of 148 J/kg. Now let’s look at the NUCAPS sounding modified for the 19Z observed surface temp and dew point.

the modified NUCAPS soudning used the surface temp of 78 and surface dew point of 69. This caused a very large difference in the surface-based CAPE, with a value of 2277 J/kg (about 7X the unmodified).   The MLCAPE also more than doubled to 328 J/kg. Interestingly, the All Sky CAPE (which is designed to match the MLCAPE more closely then the SBCAPE) at the same time in the same area gave an estimate of  1627 J/kg (not shown). That would indicate that both the modified and unmodified versions significantly underestimated the instability, but the modified gave forecasters a much better idea of the potential based on the much higher SBCAPE.

I also noticed that the mixing process the modified NUCAPS used for the surface observation produces a rather unrealistic near surface profile. I think an improvement in the mixing scheme could improve the use of the modified NUCAPS soundings further. Despite that, the current modified does give a better indication of the convective potential in this case.

Thorcaster

Comparison of All Sky CAPE to SPC Mesoanalysis CAPE products across Oklahoma

With convective initiation just starting, I wanted to to a comparison of the All Sky CAPE with the SPC mesoanlysis of SBCAPE and MLCAPE. Let’s start with the SBCAPE (all images at 19Z on 5/22).

A very sharp gradient in SBCAPE can be seen in the mesoanalysis above, with values ranging from essentially nil in the northwestern part of the state to values over 4000 J/Kg in the southern third of the state.

The MLCAPE, as one would expect during maximum surface heating, is somewhat less, with values greater than 2500 J/kg running roughly from Tulsa to Norman, and values in excess of 3500 J/kg along the Red River.

Finally, let’s look at the All Sky CAPE. These values are running about 500 J/Kg lower than the SPC MLCAPE in the Tulsa to Norman corridor, and as much as 1000 J/Kg lower near the Red River. However, it does nicely indicate the “shape” of the area that has MLCAPE, and emphasizes the area with the maximum values. This indicates the product is very helpful in a qualitative sense,  but specific values need to be used with caution.

Thorcaster