Precipitable Water Comparisons

The Blended TPW product (top left) shows promise in creating an all-observations precipitable water product in AWIPS. The polar-orbiter PW data in cloudy areas produces artificial gradients and inaccurate values compared to modeled fields (GFS top right and HRRR bottom left), but its attempt to generate an all-observational PW product is successful. I am unsure of how to suggest improvements in the cloudy areas but would encourage these model-free fields continue to be developed.

The AllSky PW product (bottom right) looks really good. The inclusion of GFS data in cloudy areas is a neat idea and the partly cloudy areas seem to be well-computed. This is a tool I will definitely use for situational awareness. -Atlanta Braves

Allsky, TPW, and NUCAPS Moisture and Instability Profiles

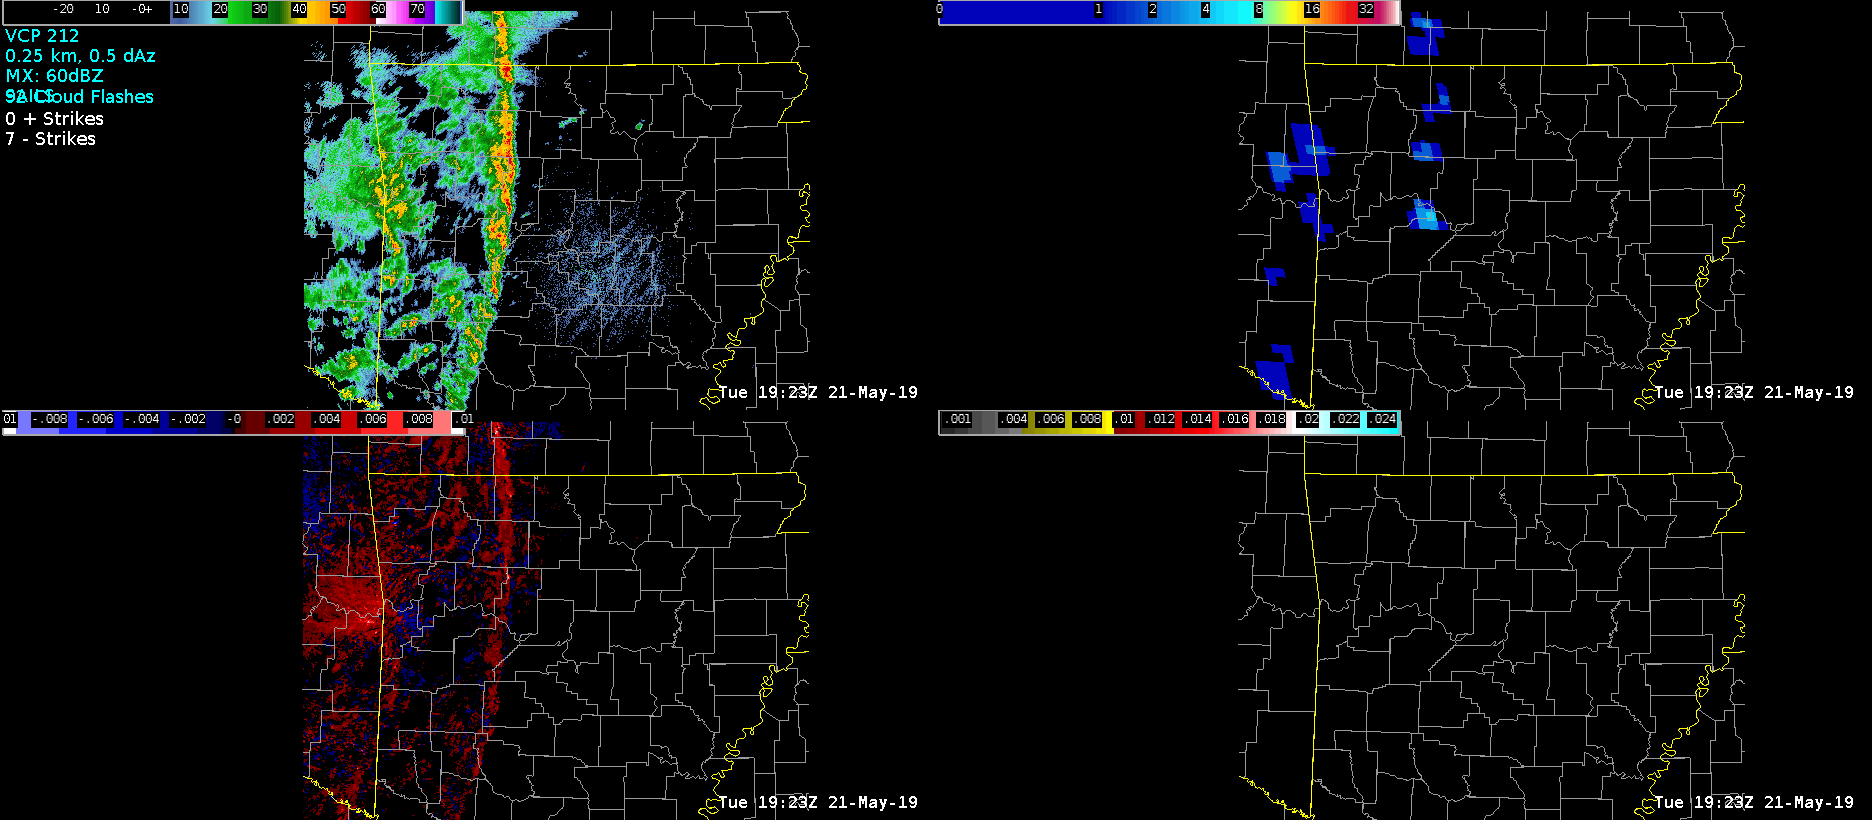
Radar image of a severe QLCS in NW Arkansas at 1923Z.  This line has been producing wind damage and a few spin up tornadoes. Next I’m going to diagnose column moisture and instability downstream, across north-central Arkansas using satellite and satellite-model merged products.
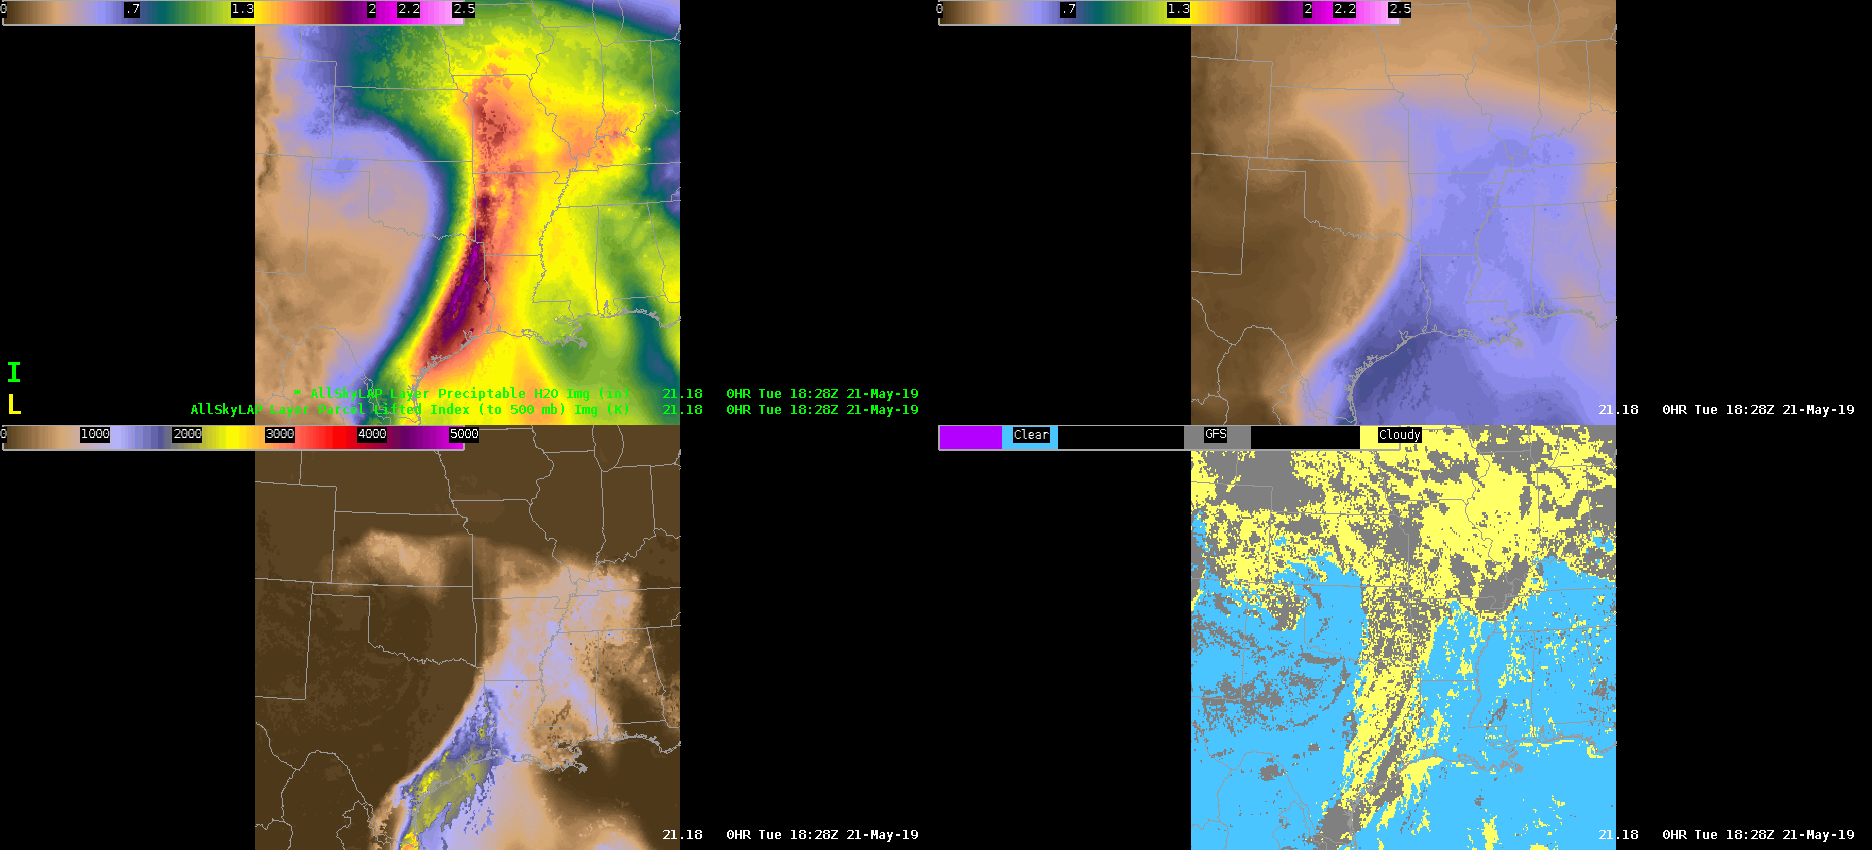
The GOES-16 AllskyLAP showed a deep plume of moisture extending from the Gulf of Mexico northward into Arkansas and Missouri.  Specifically, in north-central Arkansas, sampled PWATs were around 1.60 inches and MUCAPE was near 700-800 J/kg. Skies were mainly clear in this area, which resulted in a relatively smooth appearance in the PWAT and CAPE plots. Interestingly, and not plotted here, the 700-300mb AllskyLAP PWAT had lower values or drier conditions to the east of the approaching QLCS. This presence of mid-level dry air may be conducive for severe weather over north-central and northeast Arkansas over the next 1-3 hours — especially for damaging winds.
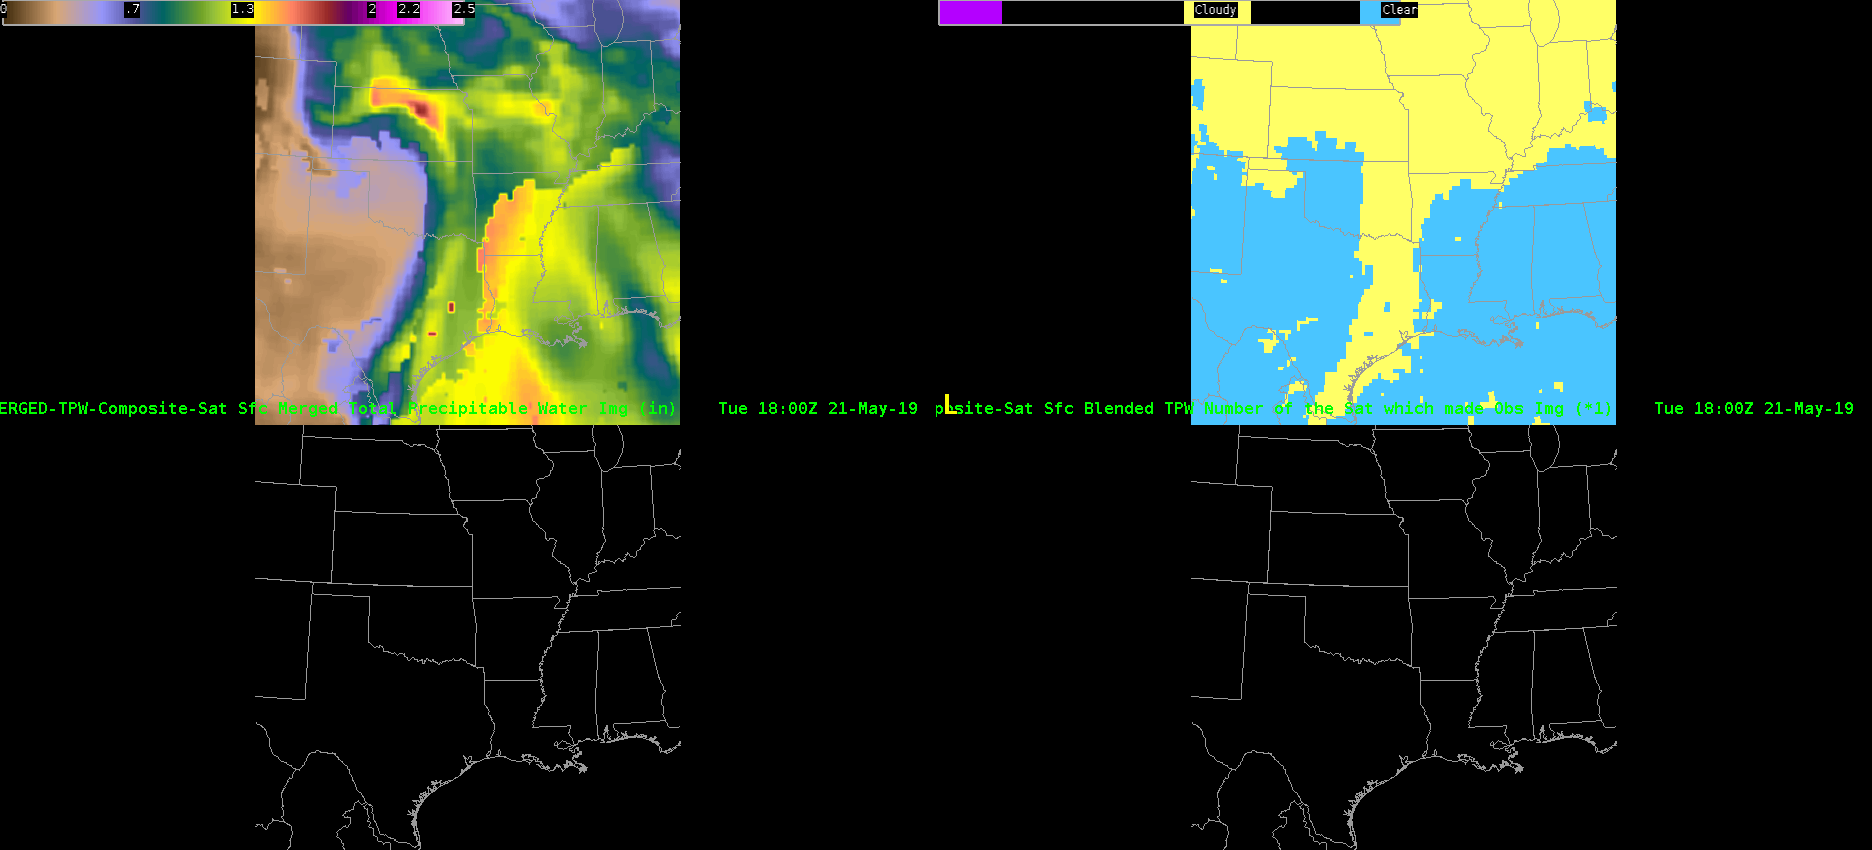
Merged TPW data at 19Z estimated PWATs near 1.50 inches into north-central Arkansas. However, there was a sharp discontinuity from 1.50 to 1.00 into the northwest part of the state where widespread cloud cover was present and the data originated from polar orbiting satellites (some of which could have been advected in). The SPC mesoanalysis did not display a sharp gradient in PWATs in this area, but rather had a gradual decrease to 1.30 inches.
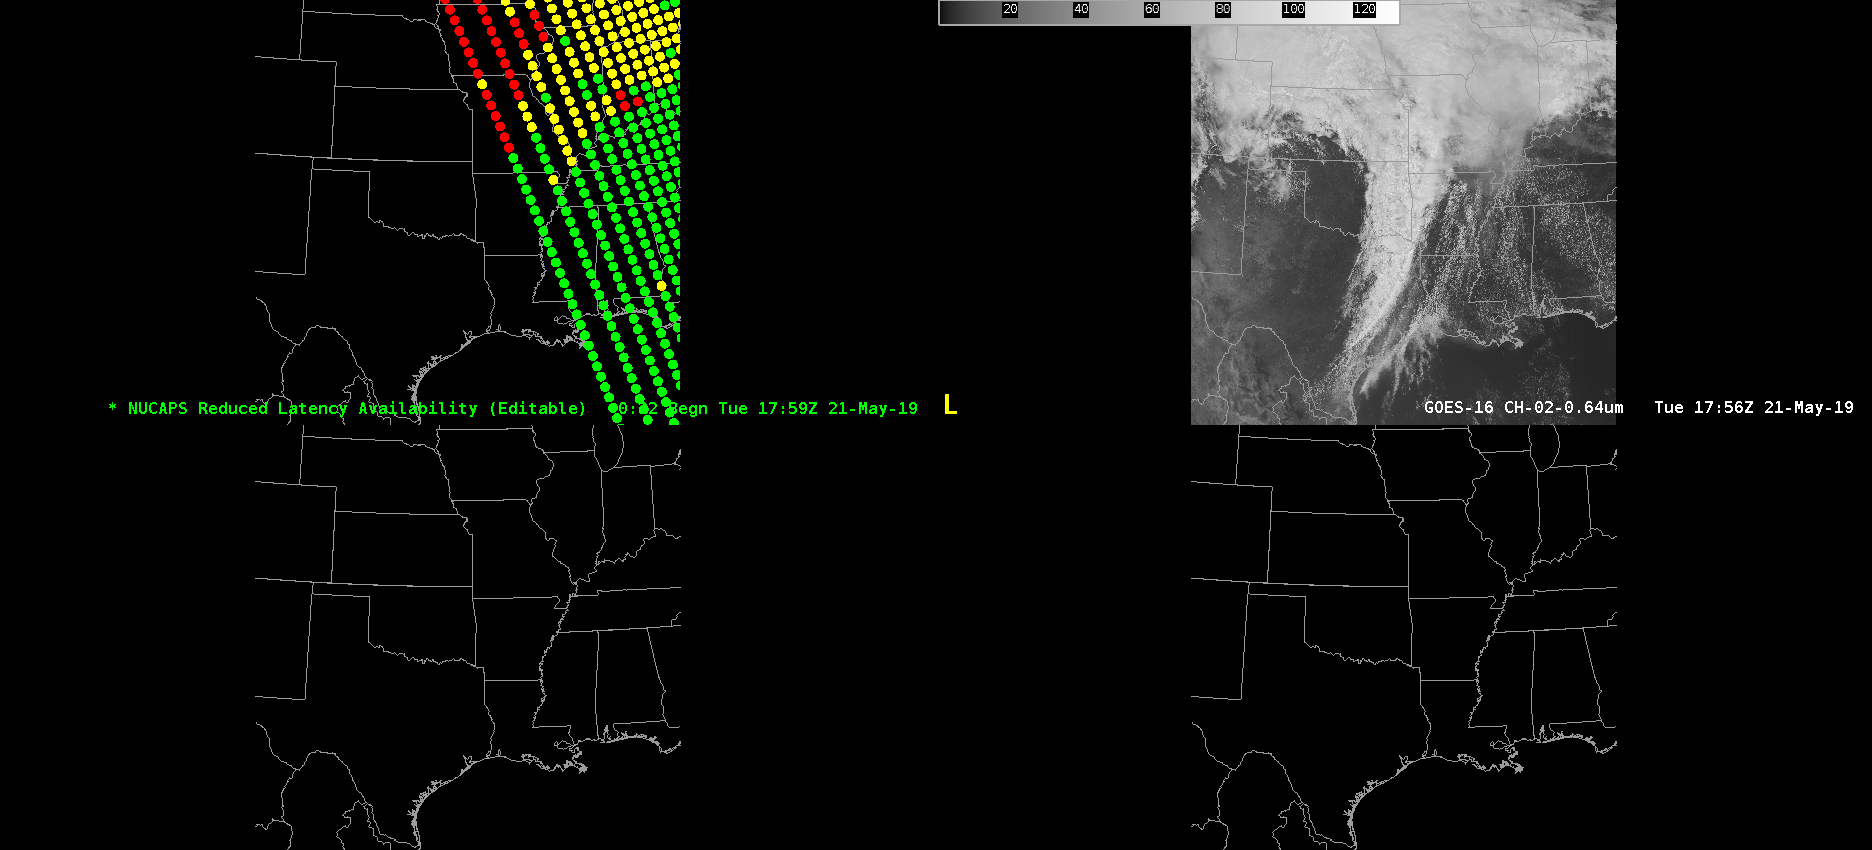
Not the best satellite pass with my area of concern on the far western fringe of the NUCAPS data. Surprisingly, the sounding data on the edge in northern Arkansas was nearly identical to the SPC mesoanalysis data with values near 1200 J/kg! It likely helped that skies were mainly clear at the time of the pass. The GOES-16 AllskyLAP data was underdone in comparison.  As mentioned, only up to 700-800 J/kg.
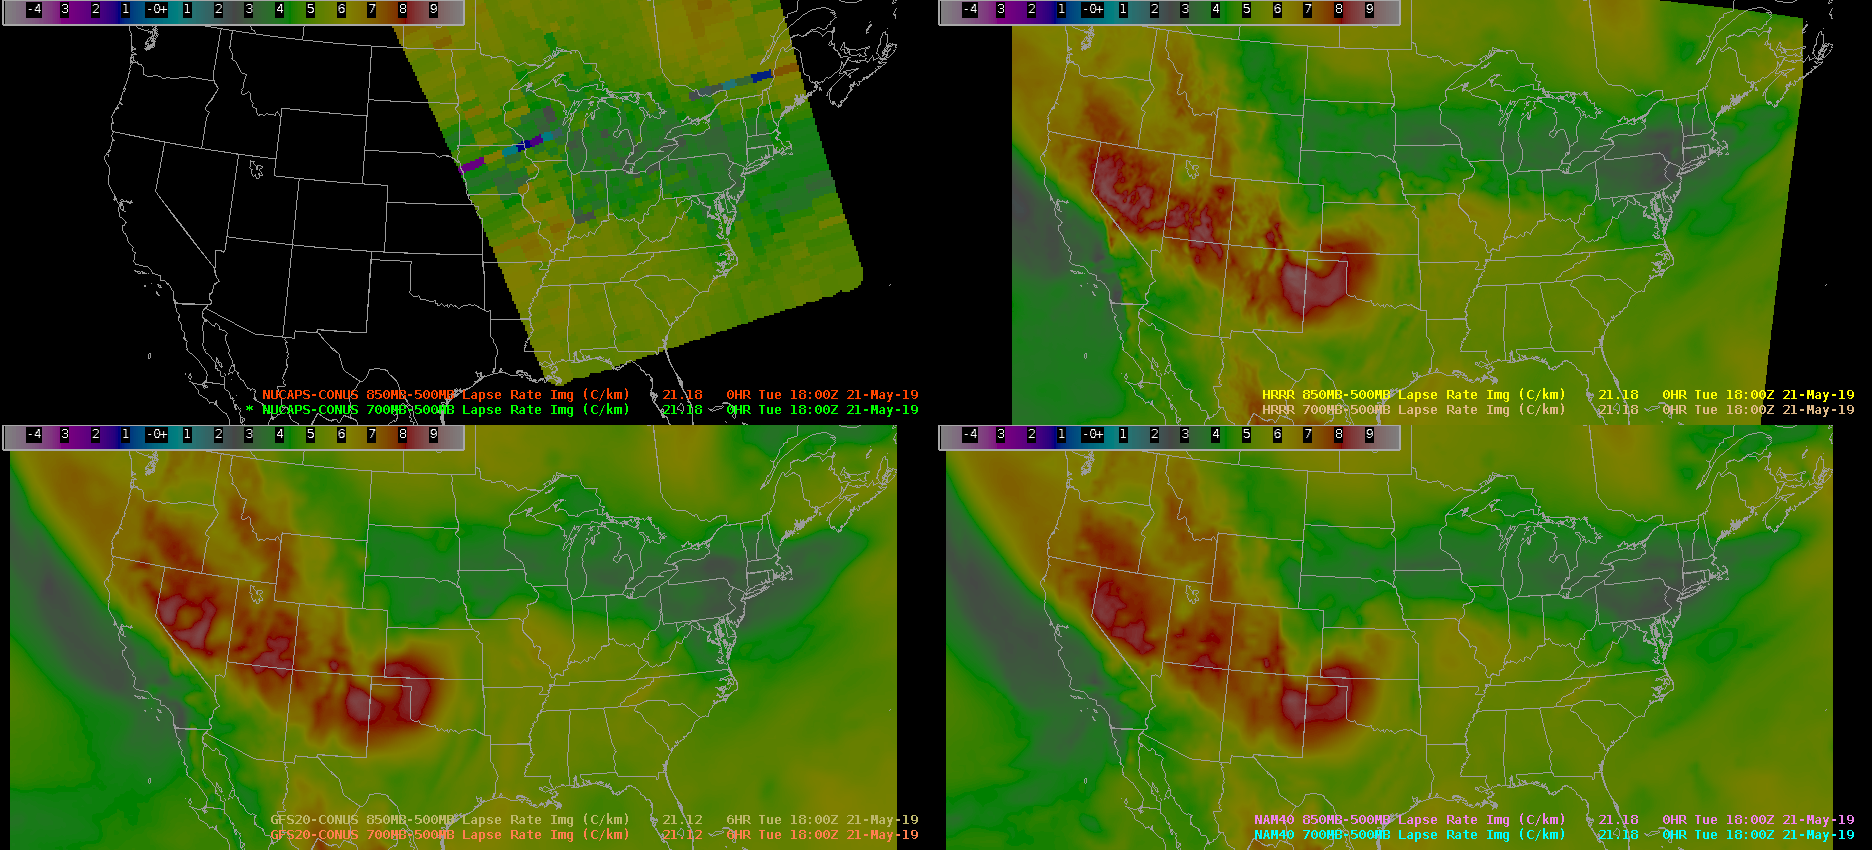
NUCAPS 700-500mb lapse rates in northern Arkansas are close to model forecasts. The NUCAPS in this pass was indicating lapse rates around 6.2 C/km. Model data was generally a little bit lower around 5.8 C/km.  The SPC mesoanalysis was on the high end near 6.5 C/km. Roy
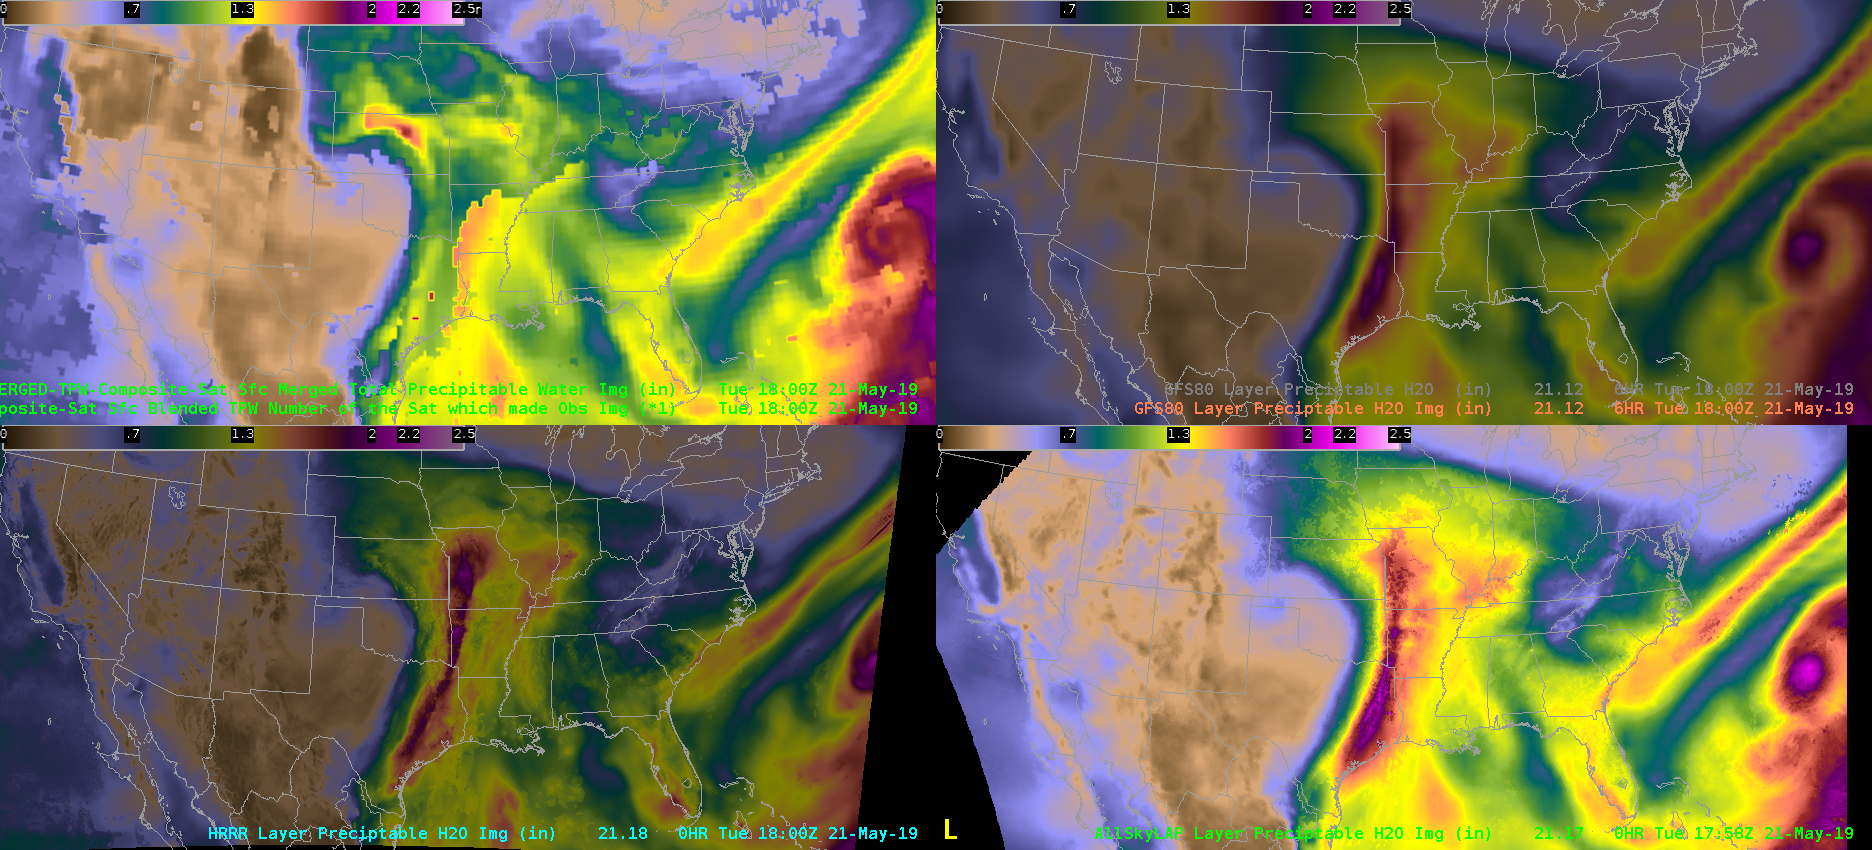
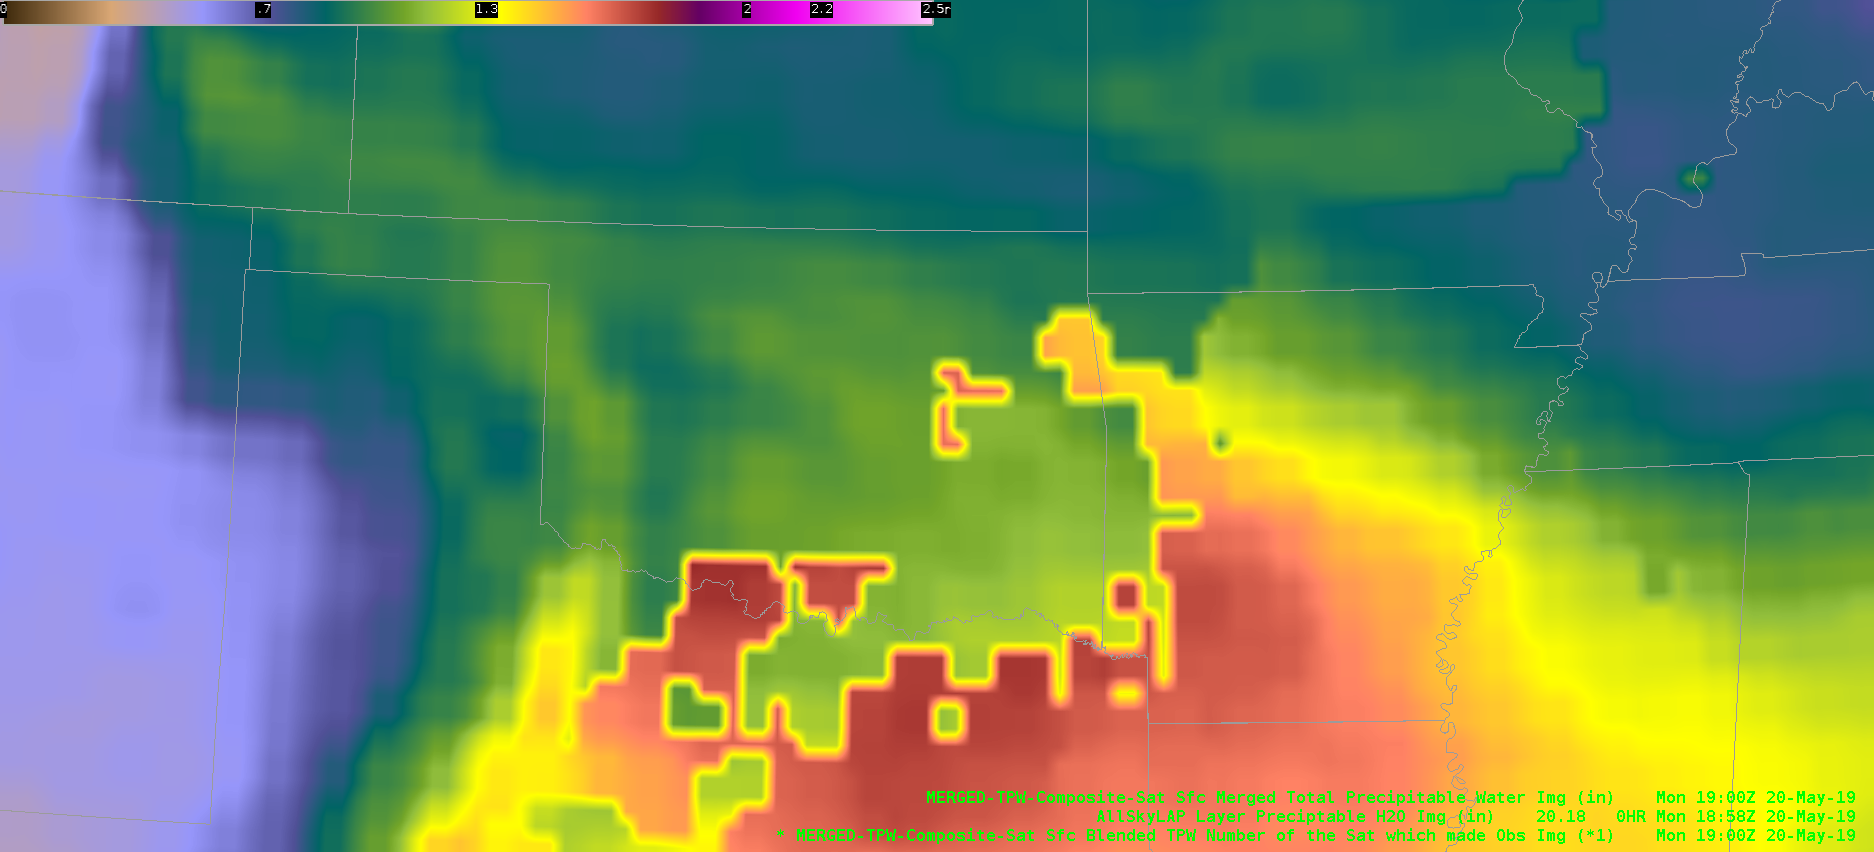
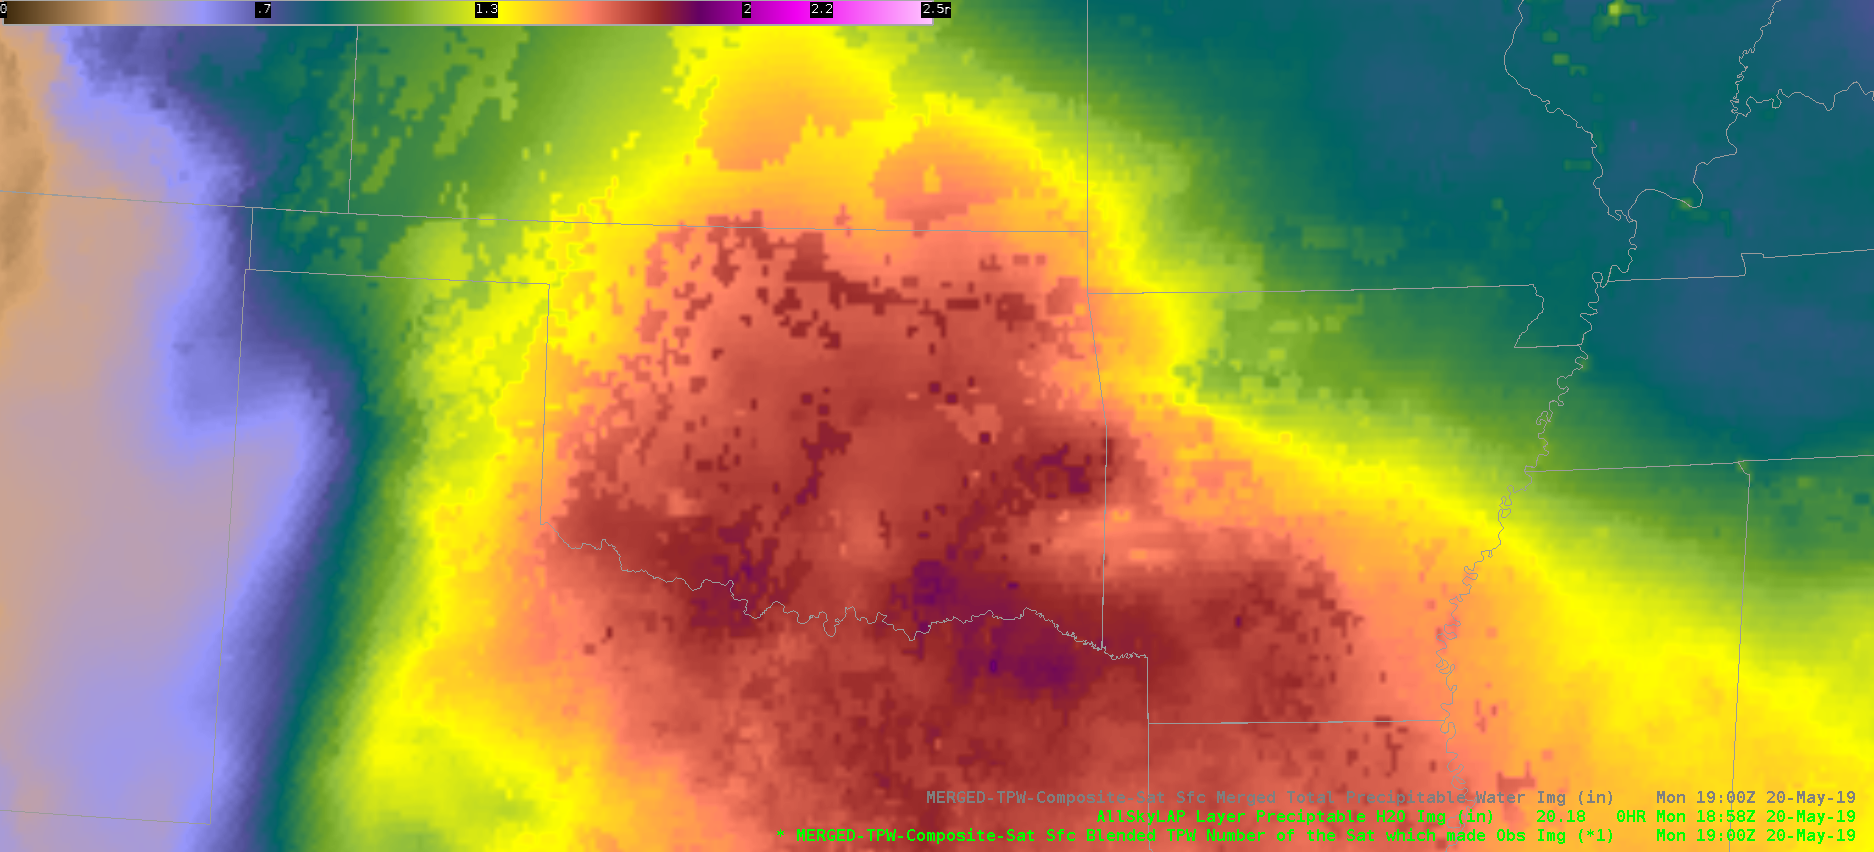
Merged Advanced TPW Too Low in Cloudy Areas this Afternoon

The Merged Advanced TPW is underdoing PWAT values in cloudy areas over central Oklahoma. There are discontinuities where it goes from clear to cloudy skies.

The 18z KOUN RAOB sampled 1.52″ PWATs, while the Advanced TPW is showing only around 1.00″.

Meanwhile, the All Sky LAP PWAT appears to be better representing reality, with PWATs around 1.70″

Ron Dayne

Comparison of ATPW and Blended TPW

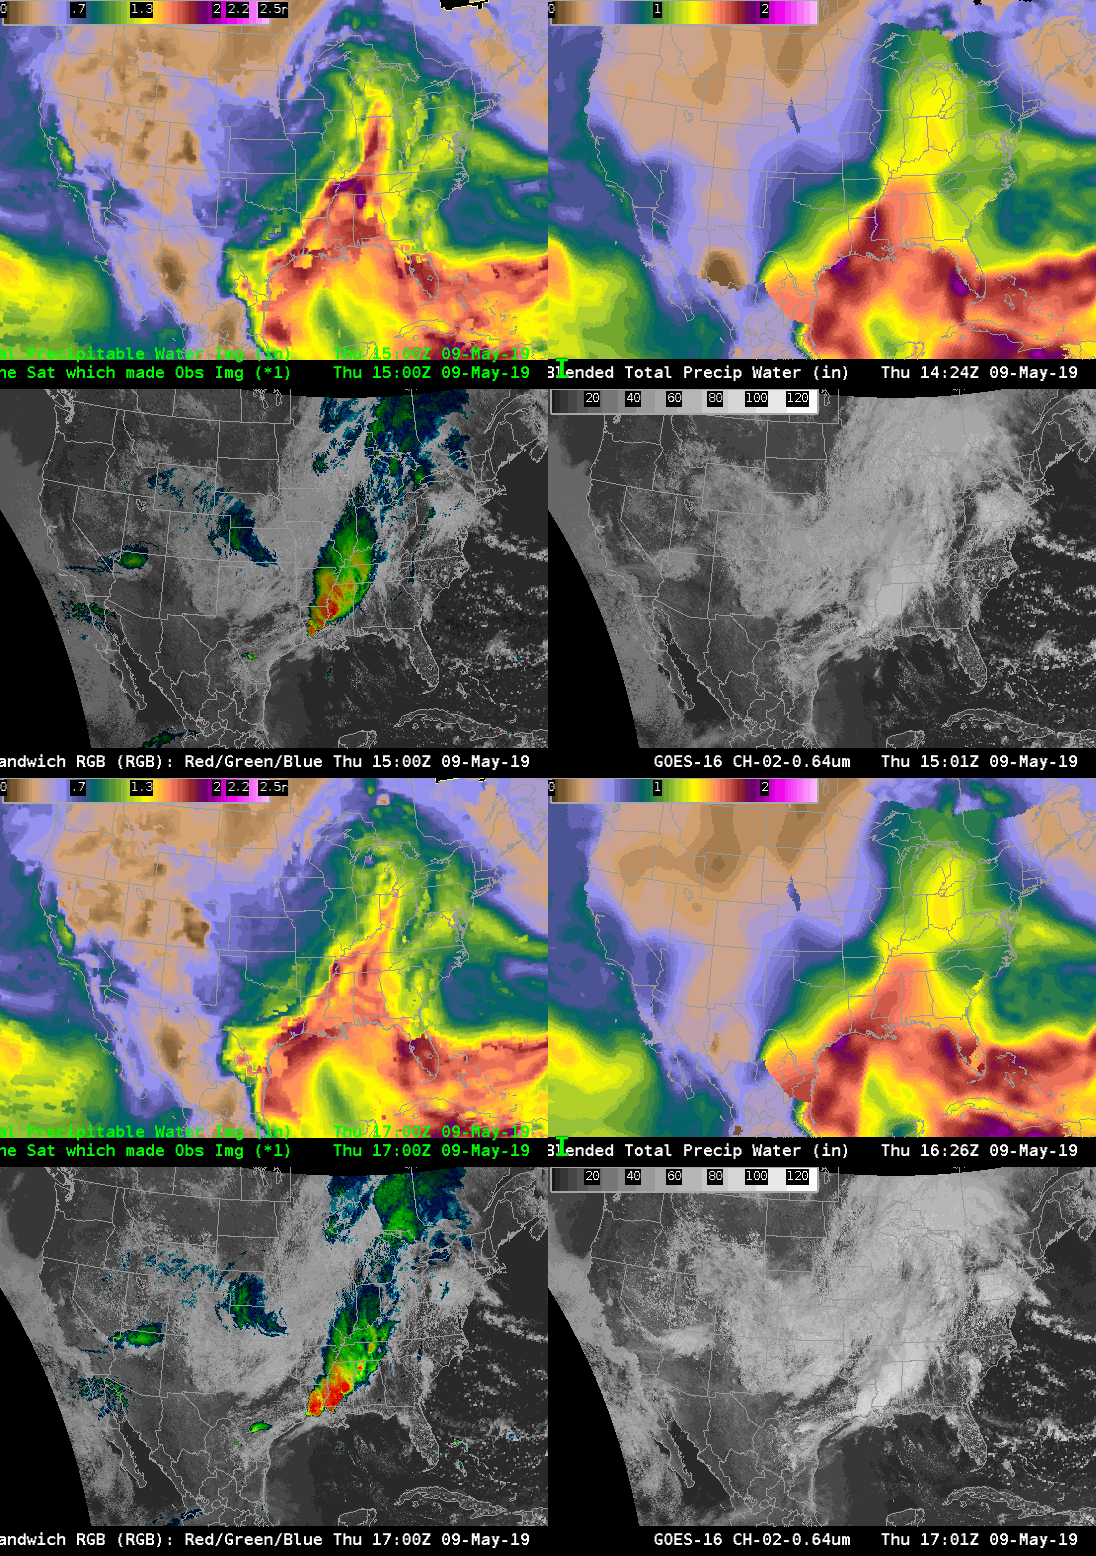
I was finally able to take a look the ATPW (top left) and compare it with the operational blended TPW (top right). My first impression was that both products show similar large scale patterns with a large plume of moisture extending from the Gulf of Mexico into the Ohio River Valley. The ATPW also tends to show a little more detail in the moisture field compared to the blended TPW.

At 15Z ATPW shows an area of lower moisture over the Texas Gulf coast which is sort of fills in by 17Z, likely due to upstream moisture being advected into the area. In contrast, this moisture is continuously present in the blended TPW. ATPW generally had PWATs around 1.5 in, while the blended TPW had PWATs around 1.7-1.8 in. In contrast, 12Z RAOBs along the coast had PWATs that ranged from 1.6 inches at KBRO to around 1.8 at KLCH. These values seems to match better with the blended TPW product. I suspect that the upstream convection over Louisiana and lingering clouds over the coast impacted the ATPW that was corrected in the blended TPW.

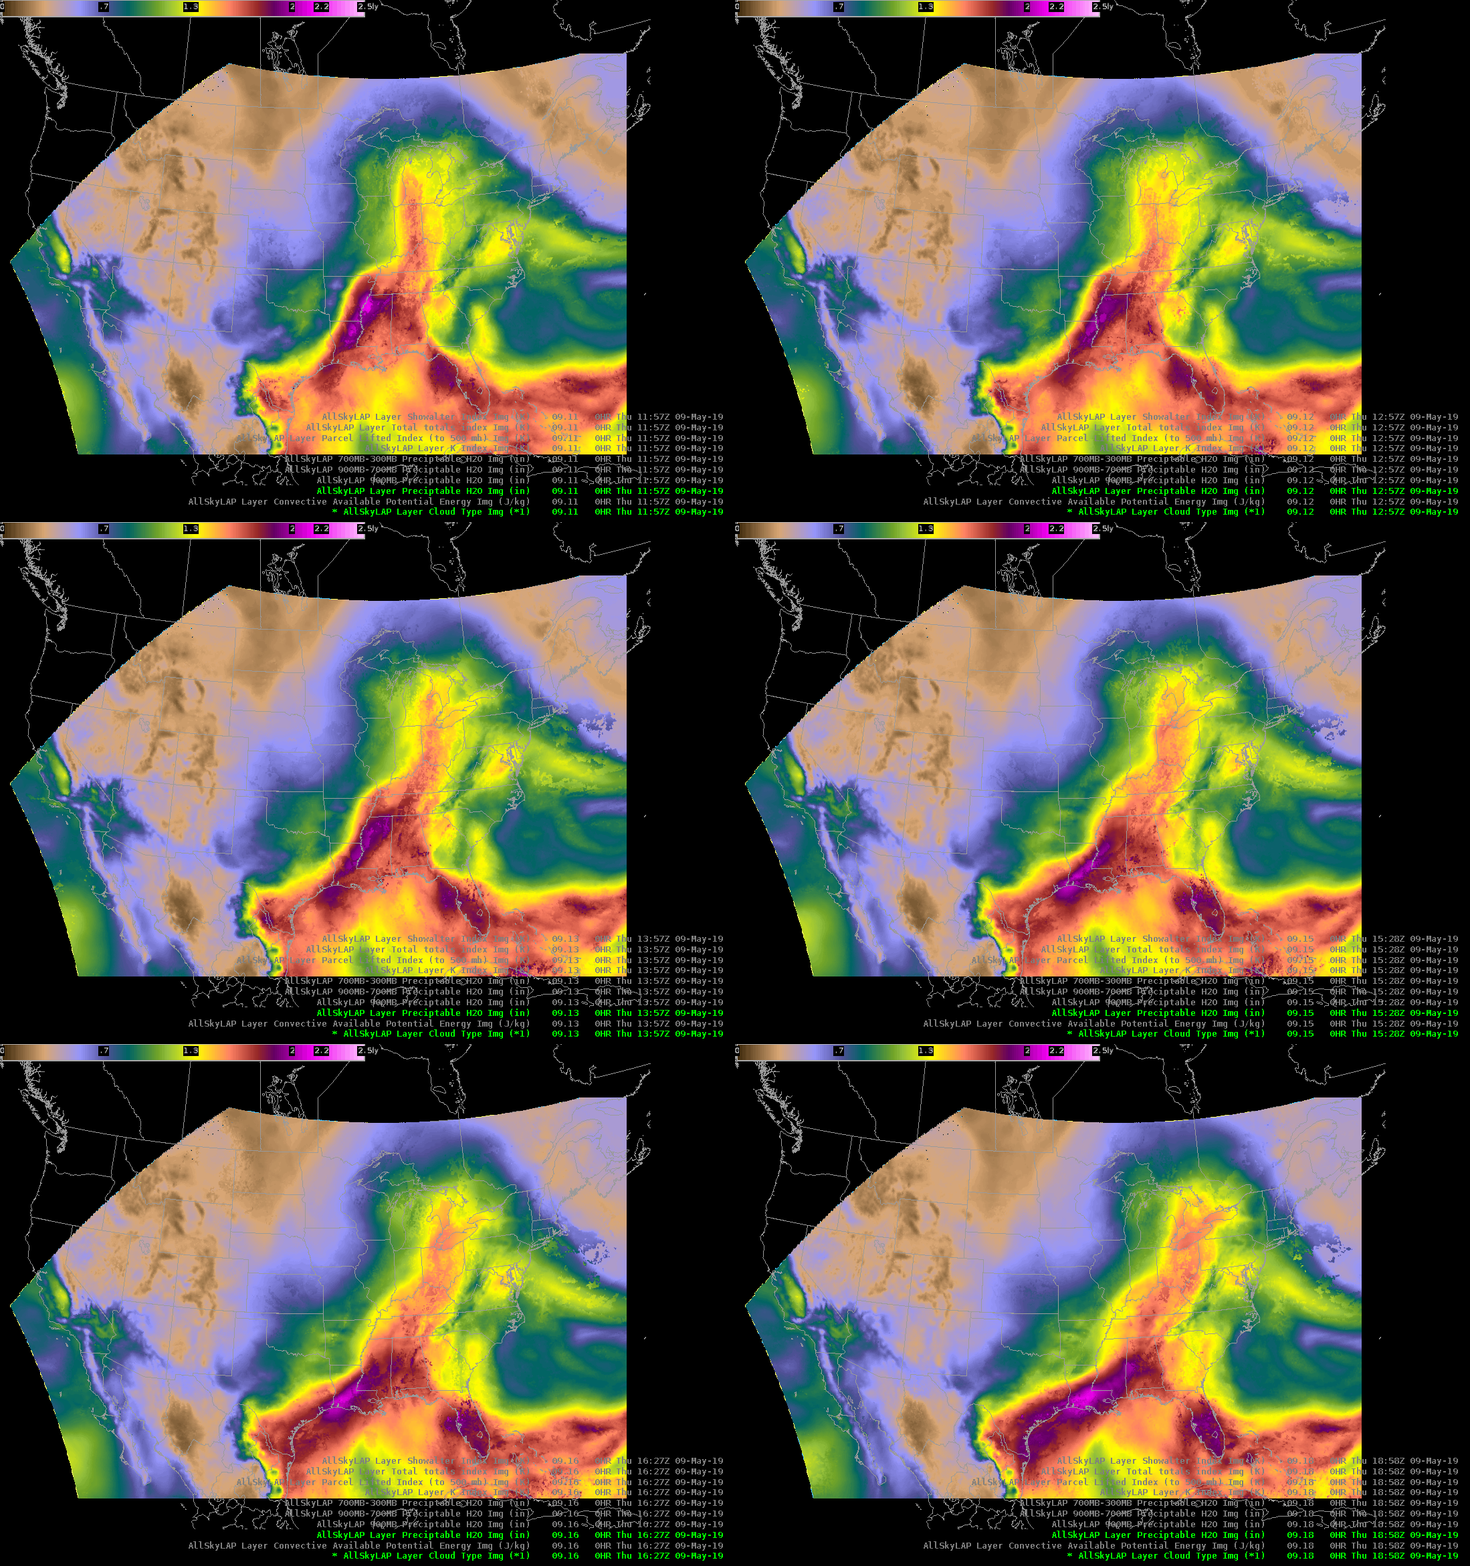
Update…Below is a loop of the LAP All Sky T PW. This loop shows a similar pattern to the ATPW and Blended TPW with a large are of gulf moisture moving into the Ohio River Valley. It is interesting/good to see that the LAP All Sky TPW is picked up on the sea breeze kicking in along the Gulf Coast. Despite the subtle differences among the three products the fact that they show similar patterns gives increase confidences that we will likely see a large area of flash flooding across portions of the south if storms are able to develop.