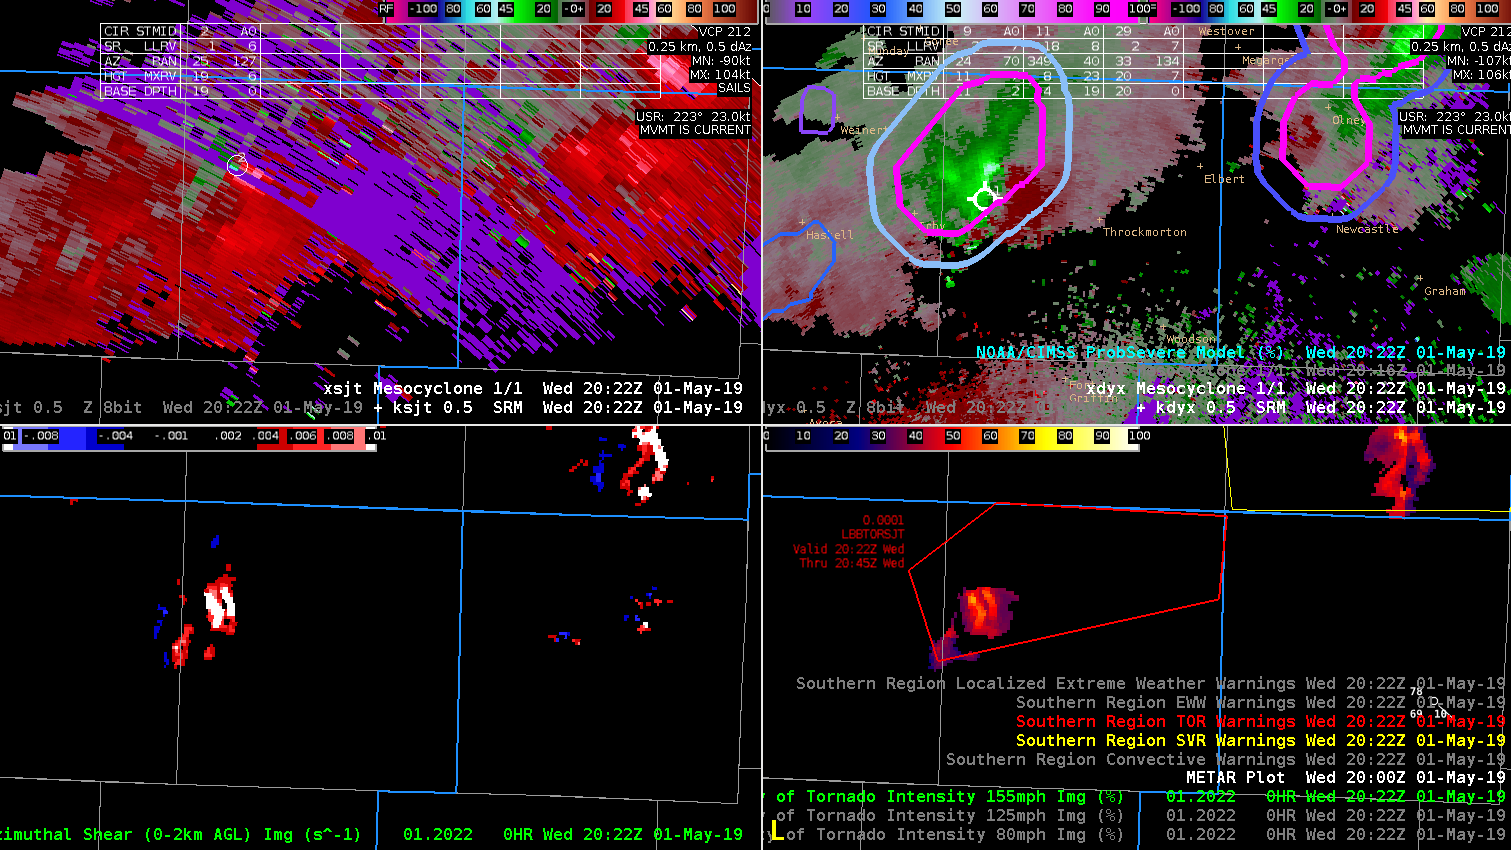
Tight couplet on cell in NE Oklahoma but significantly displaced AzShear bullseye. This resulted in a misplaced MDA algorithm detection as well.
CPTI performed well with a 26% of a strong tornado. -Atlanta Braves

Tight couplet on cell in NE Oklahoma but significantly displaced AzShear bullseye. This resulted in a misplaced MDA algorithm detection as well.
CPTI performed well with a 26% of a strong tornado. -Atlanta Braves
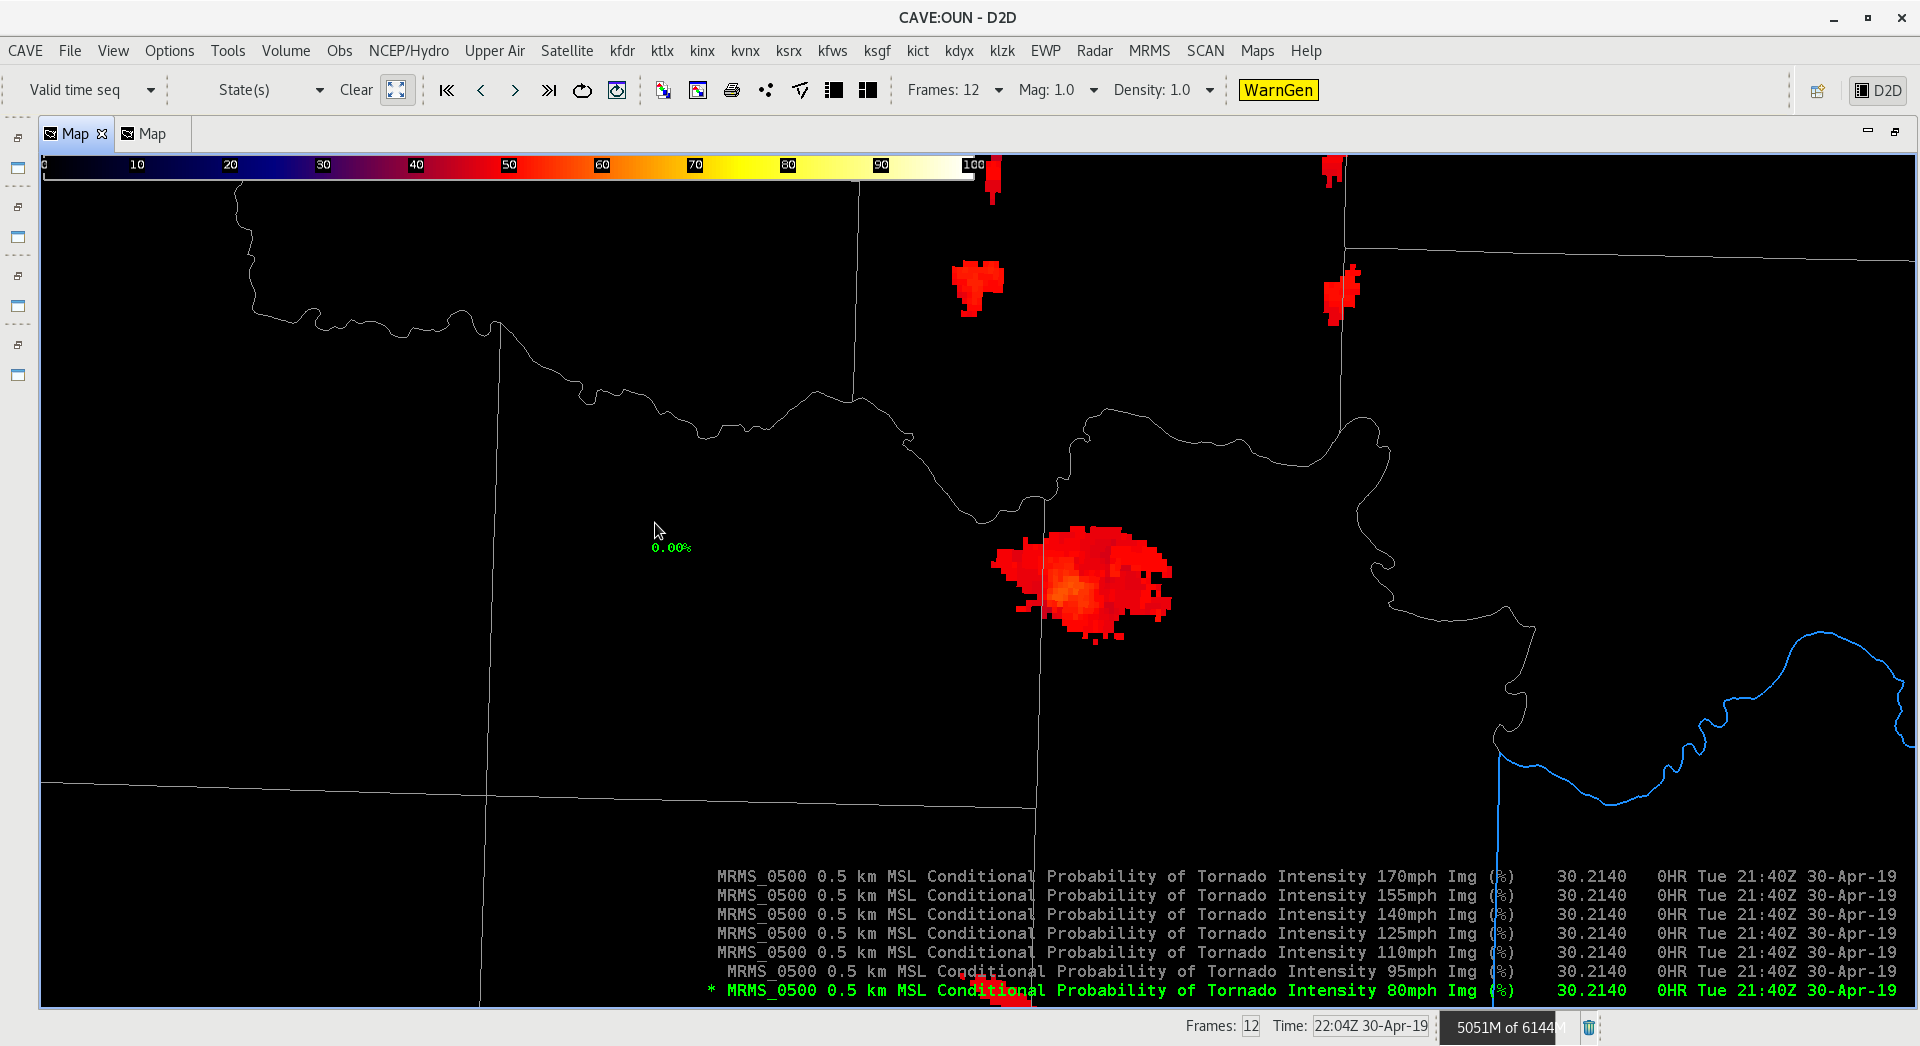
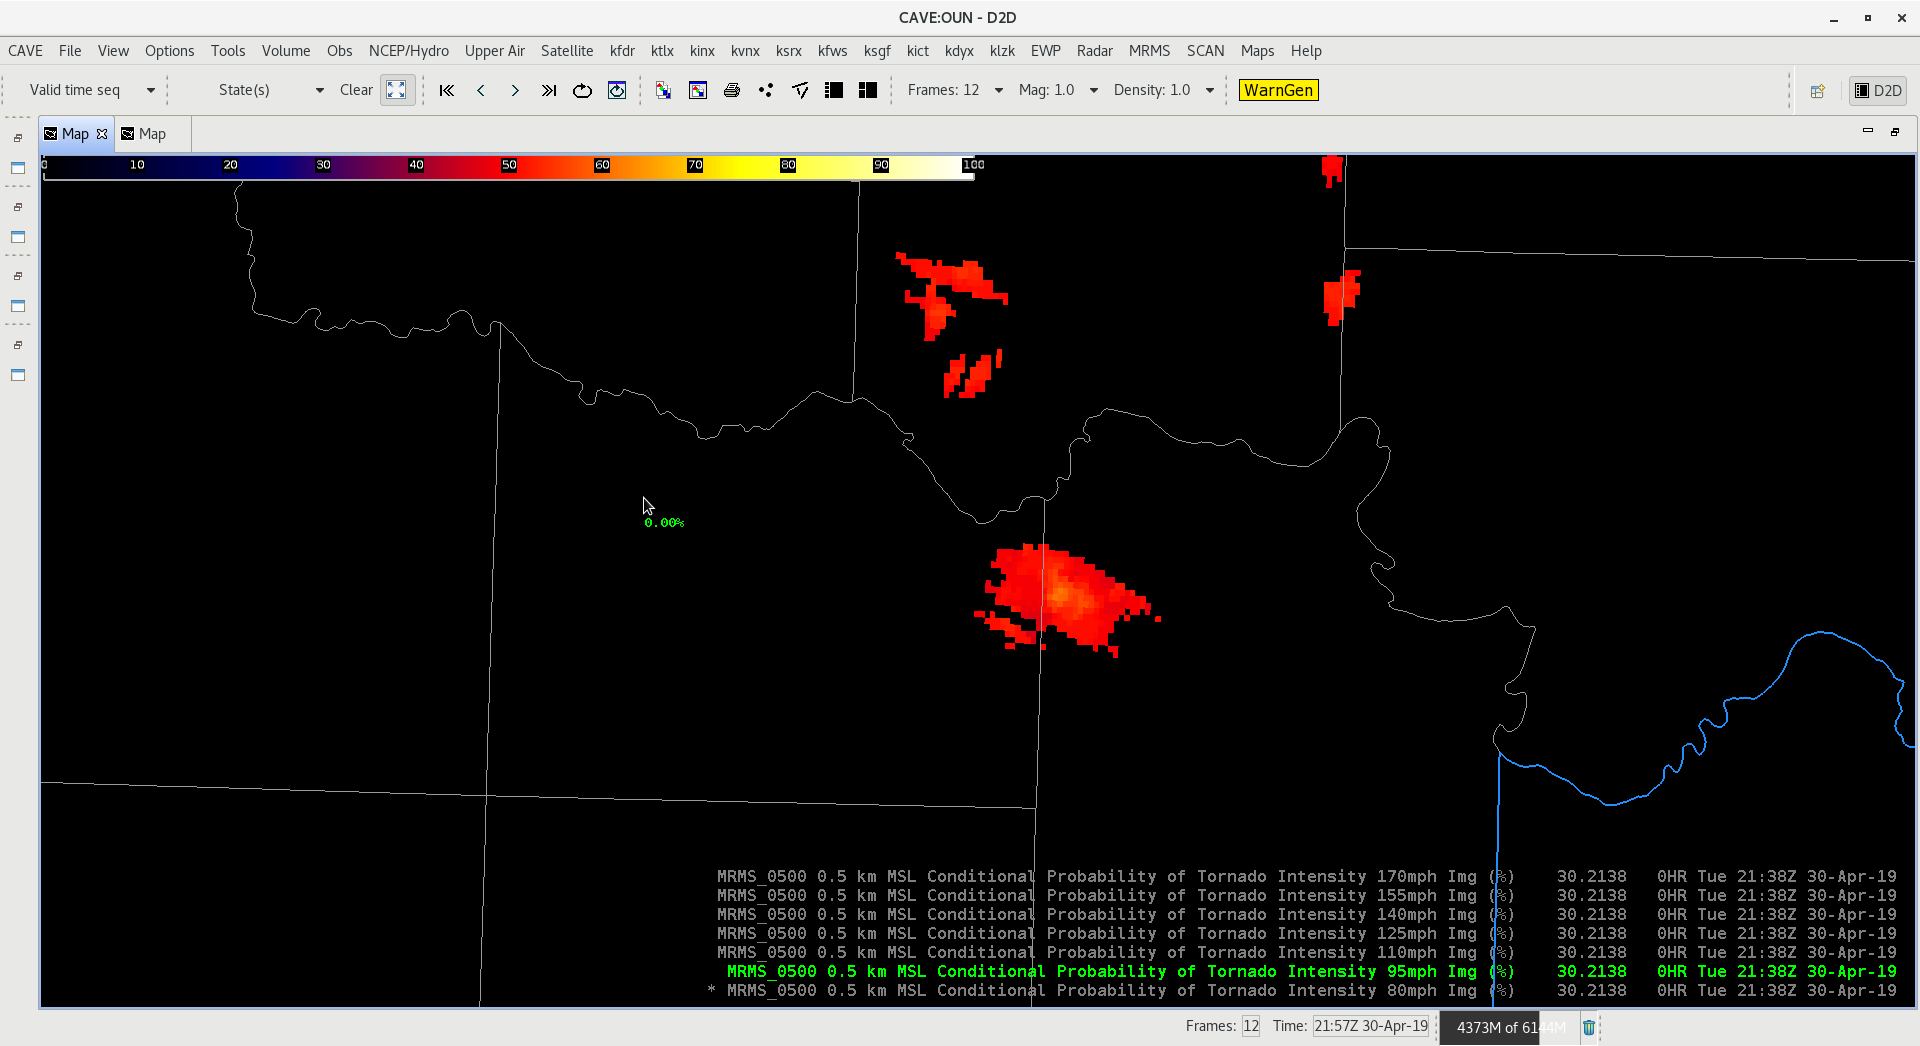
A tornado produced a TDS in the SW part of the Tulsa WFO CWA at 21:44Z. Maximum TDS height was ~6kft.
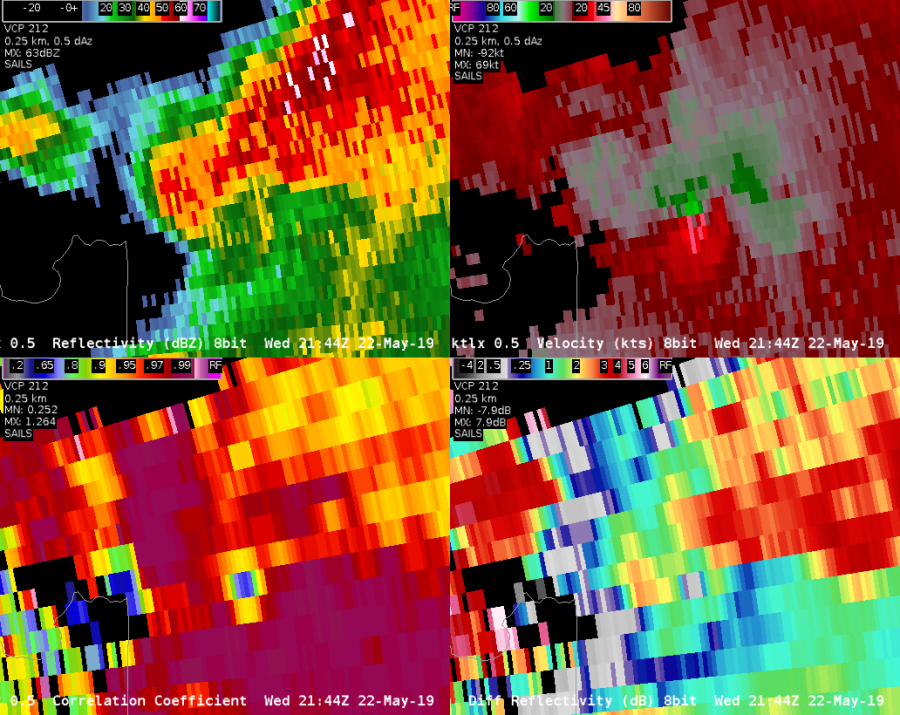
The CPTI adequately represented an increase chance of a strong tornado (18-20%, top left).
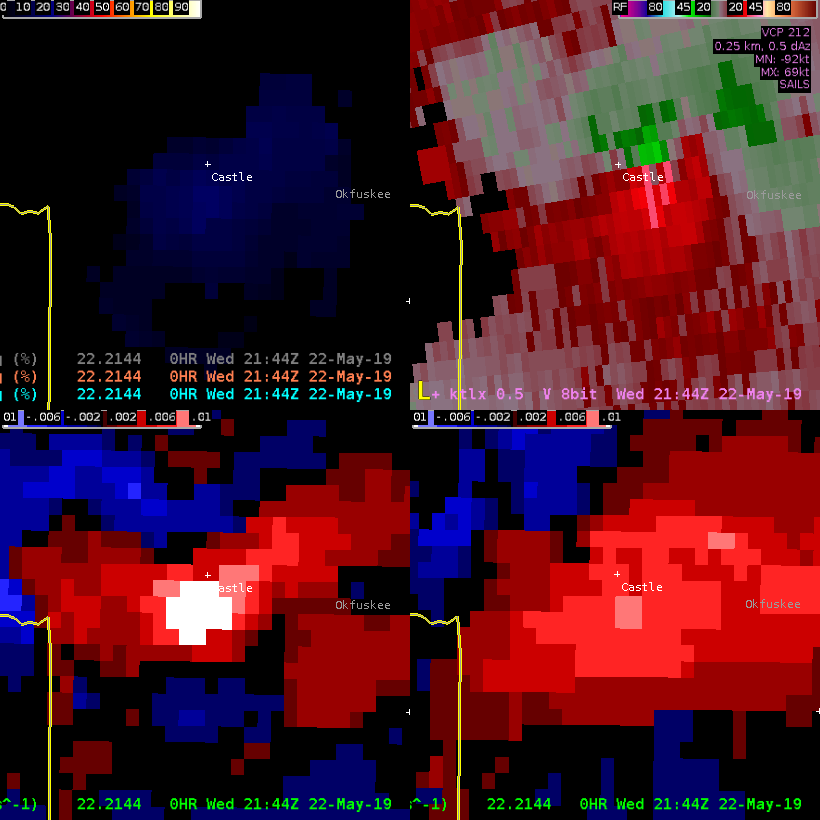
It appears this CPTI did not have the same issues with effective STP like yesterday’s St. Louis tornado did. I like this product a lot! -Atlanta Braves
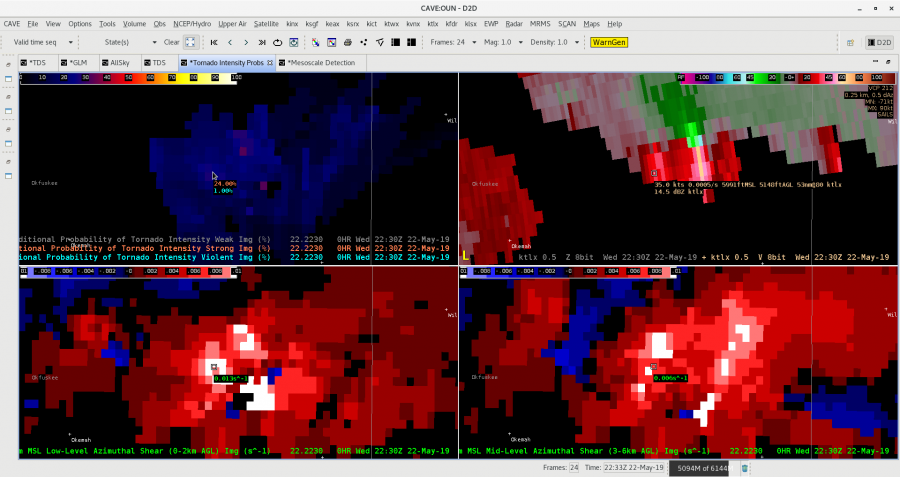
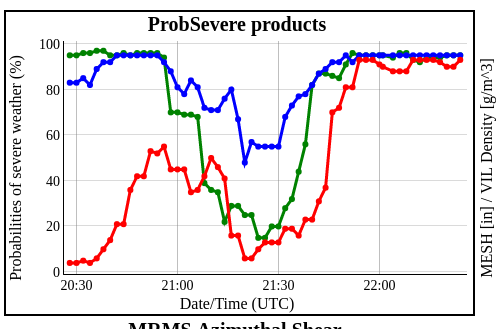
On May 22 at around 2130Z, a tornado warning (test) was issued for Okfuskee County in the Tulsa CWA. Besides the usual examination of base velocity data, other tools that were used to help the decision were the merged AzShear products and the CPTI products. Watch the loop below.
In this four-panel, the upper left has the 0-2 km merged AzShear, the upper right has the 3-6 km AzShear, the lower left has the Weak/Strong/Violent CPTI products overlayed on each other, and the lower right has the 0.5 degree base velocity.
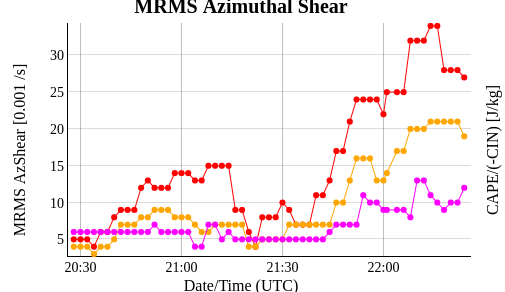
At the beginning of the loop, the max 0-2 km AzShear values were .008 s^-1, but increased throughout the loop, eventually reaching .012 s^-1, exceeding the .010 threshold. The 3-6 km AzShear showed a similar trend.
The CPTI product showed a noticeable trend as well. At the beginning of the loop the weak/strong/violent values were 89/11/0 %, respectively. Since most every value of AzShear starts with 100% weak, the values were not overly supportive. However, by the end of the loop, the values were 75/23/2 % respectively, a significant increase in the threat of both strong and violent tornadoes. With the limited experience I have using the product, once the strong gets to 20% or higher, and the violent gets to 2% or higher, it greatly increases the confidence in needing a tornado warning.
Thorcaster
An embedded supercell produced a significant tornado just west of the KLSX radar near St. Louis around 6pm CDT. The tornado produced a tornado debris signature and impressive debris ball (>65 dBZ) at its peak intensity.
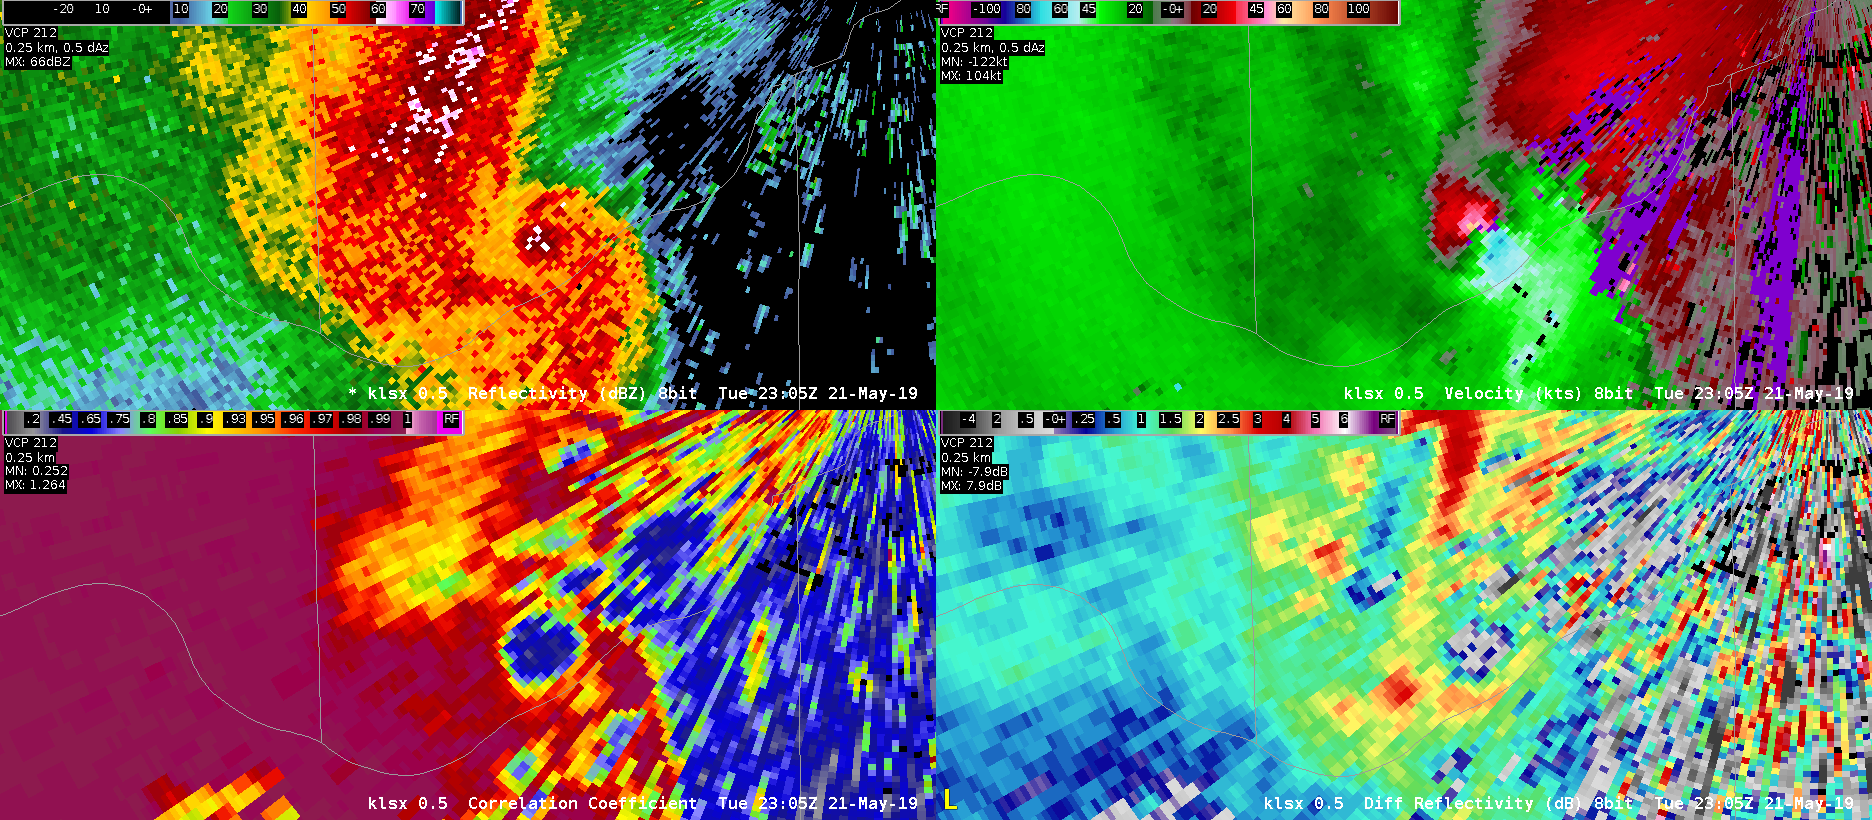
The tornado debris signature reached a height of ~10kft at the 10 degree elevation scan, characteristic of an EF-2 tornado.
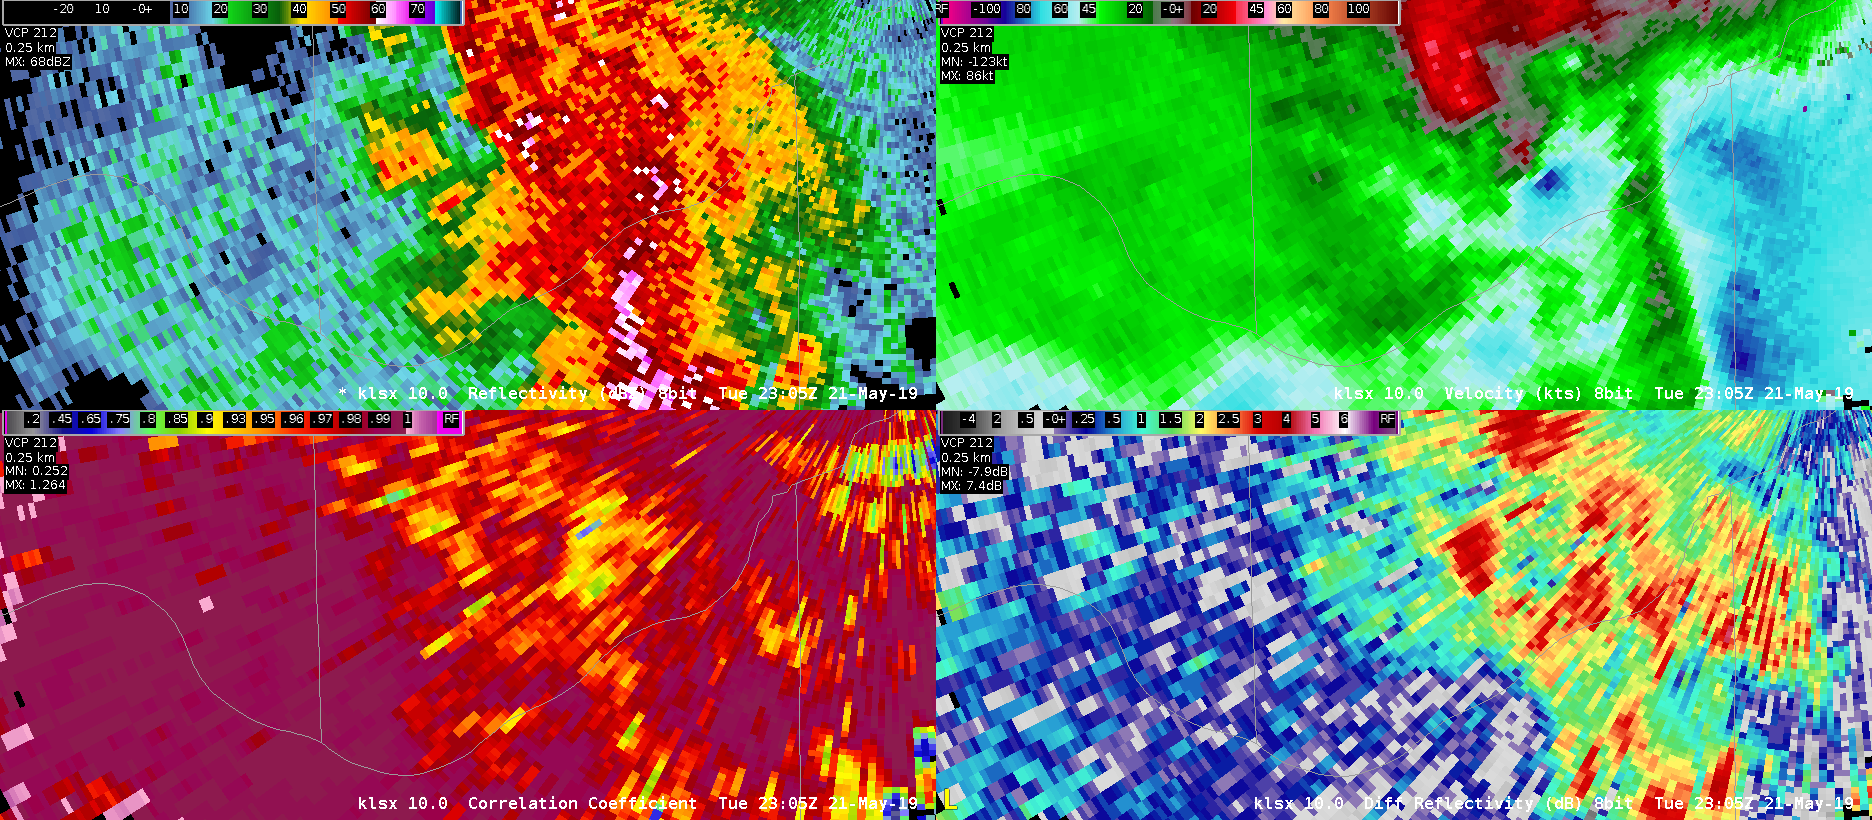
This case provides a great opportunity to investigate the performance of CPTI. The algorithm identified a maximum probability of strong tornadoes of 22% and a maximum low-level AzShear value of 0.030 /s. Based on the AzShear value, it seems the CPTI for strong tornadoes should have been stronger.
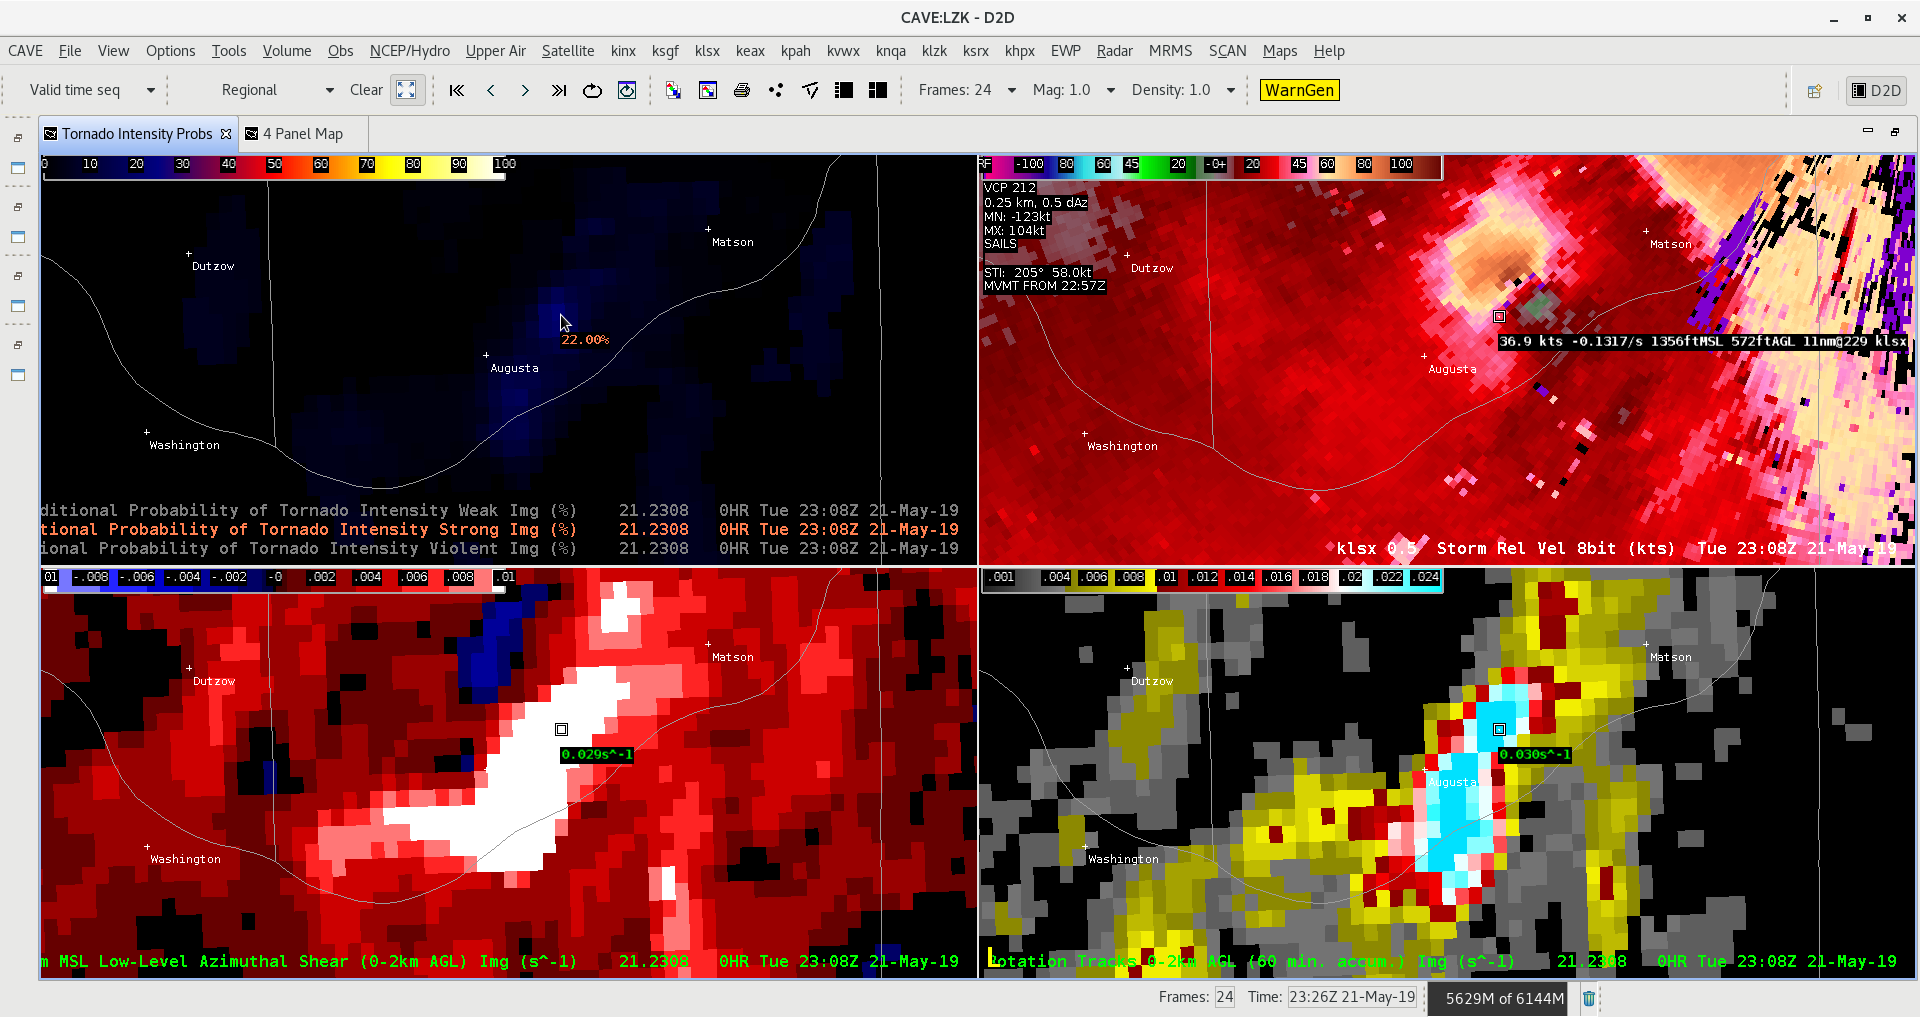
A little digging showed that the MRMS STP value was 0 near St. Louis, while the SPC Mesoanalysis page showed an STP of 4. This discrepancy explains the suppressed strong tornado CPTI and should be investigated. Perhaps there is a latency issue with the MRMS STP data.
I really like the CPTI product for clear-cut tornadoes and see it being very helpful for IBW updates for an ongoing tornado.
-Atlanta Braves
A tornado was observed via news footage near Mangum, OK. The formation of this tornado was associated with an increase in CPTI for strong tornadoes to 46%:
The CPTI for violent tornadoes also increased to near 6% (not shown).
The ProbTor on this storm increased markedly between 2140-2155 UTC:
This increase was driven by an increase in AzShear:
Ron Dayne
 Just after 20z on the eastern fringe of the LUB CWA, the KFDR radar indicated an area of very high inbound velocity. However, this data is in question as the elevated velocity occurred in an area of low Z and high SW, and likely not representative of the actual storm. This may have been caused by a side lobe. This had cascading affects with algorithms being tested which could not filter out the bad data. Low level az shear spiked to over 0.01 in a group of stationary pixels. This caused algorithms that ingest the az shear product to spike including ProbTor which increased to over 90%, as well as CPTI which showed lower end probabilities of a violent tornado in progress.
Dave Grohl
AZ_shear was showing double shear signature and also showed in the CPTI product. Did finally see a bit of an increase on the 155mph for CPTI, however the 125mph and 80mph were similar values. My conceptual thinking would be that 80mph would be 100%, 125mph 80%, and 155mph 60%, thus would make more sense versus all threshold values being closer to 50-60% range. -Jake Johnson
CPTI closely followed the 0-2 Az Shear product in both shape and intensity. This included all velocity time matching errors. These time matching errors decreased the usefulness of the product each time they were seen. CPTI prob of highest winds appeared more useful than the lower thresholds, better enhancing where the threat of strong winds was actually located. Lower thresholds (example at end of loop) appeared to be too broadbrushed for applicable use.


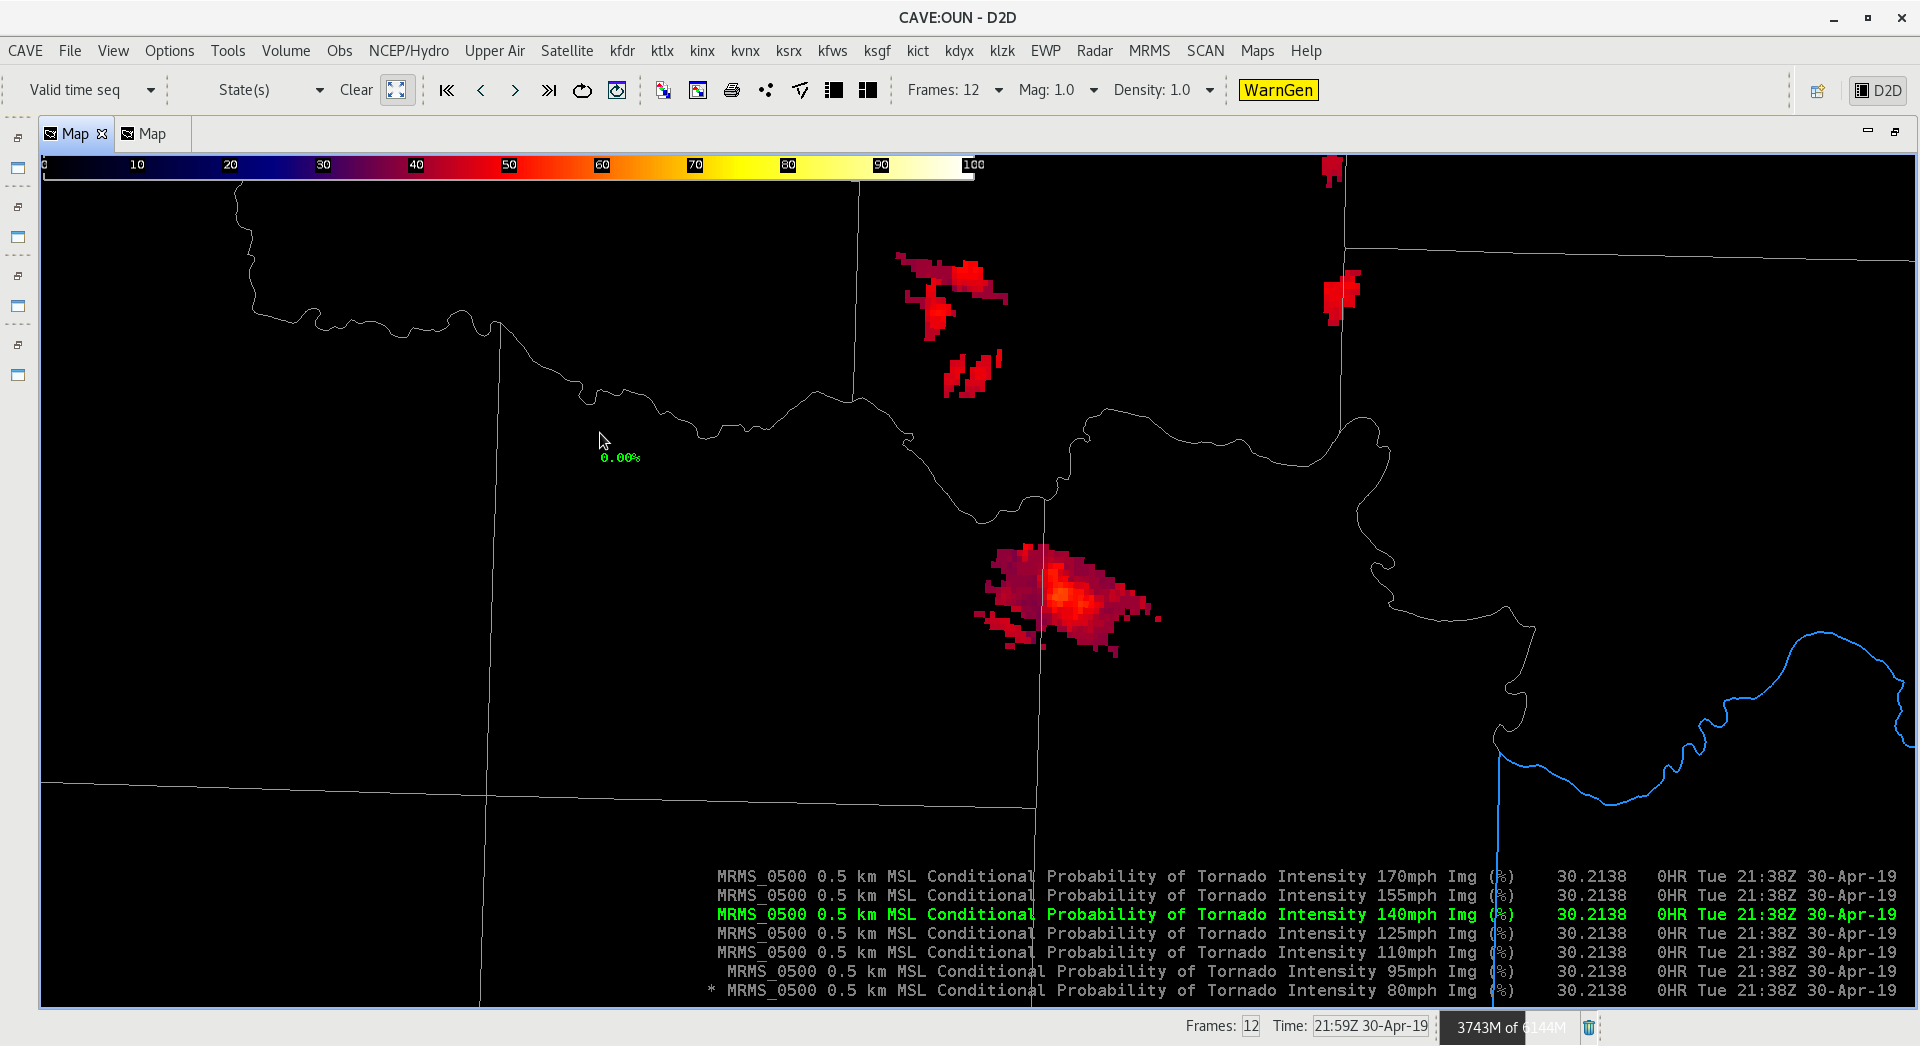
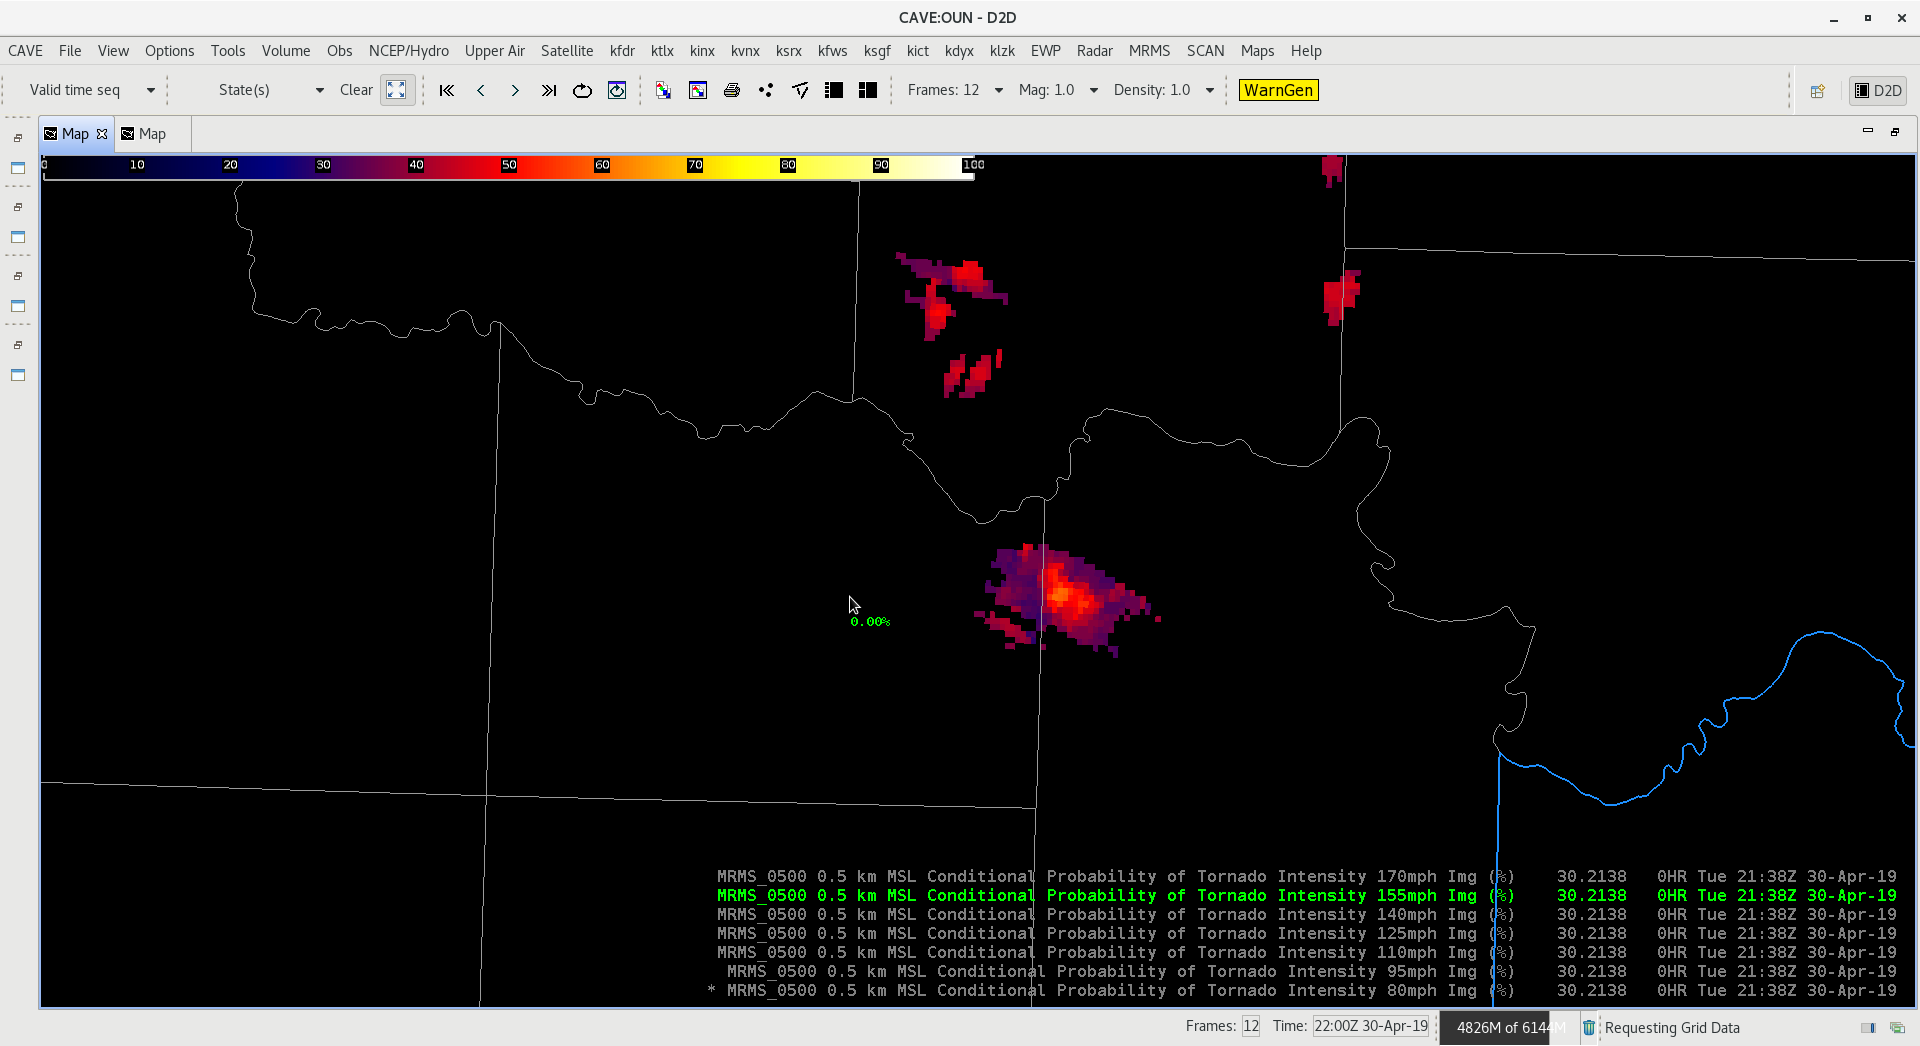
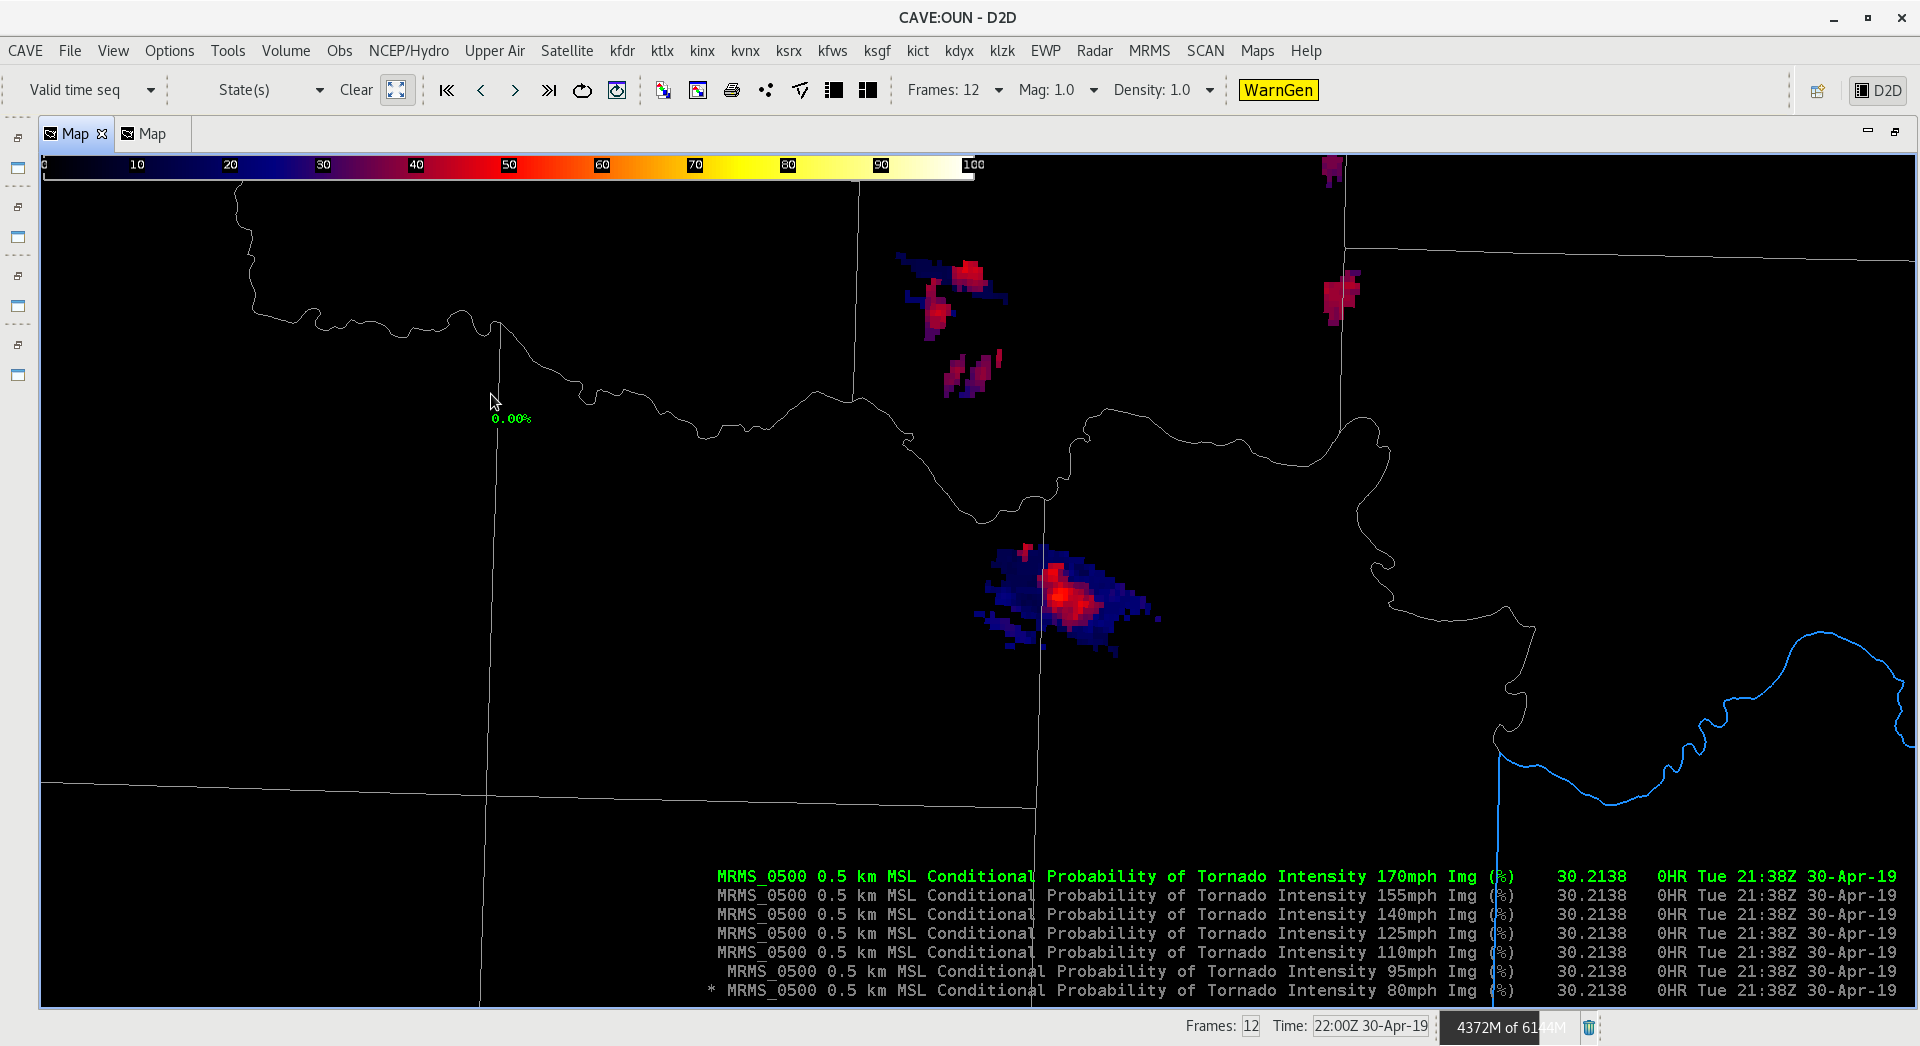
CPTI product shows very little change in the probabilities from one level to the next, therefore i recommend doing ranges with this analysis. This should highlight the threshold ranges of interest in a better way.
For example: Cat 1 (80-110mph), Cat 2 (125-155mph), Cat 3 (170+ mph)
-Jake Johnson
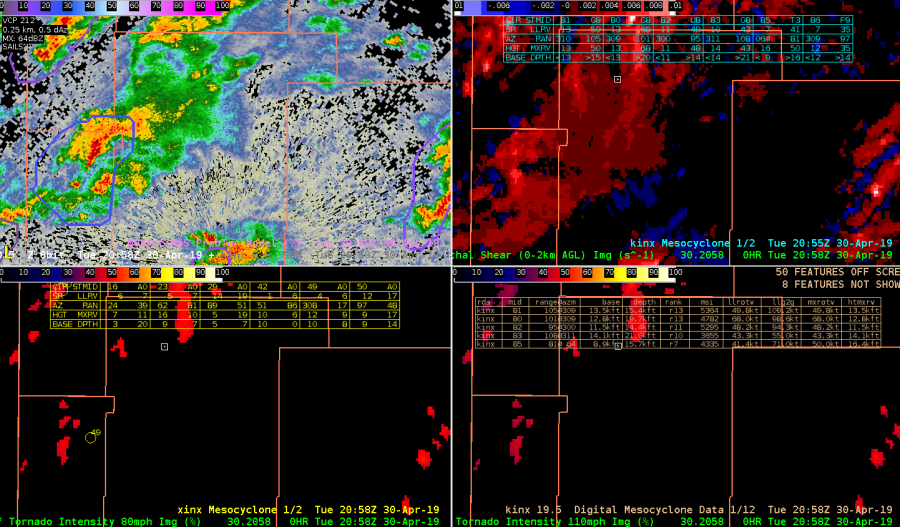
Gonna take a look at SC merger noting two small SC storms WNW of KINX radar @ 2058UTC. Prob TOR with these storms ~ 25% at this time with generally weak AzShear with stronger northern storm.
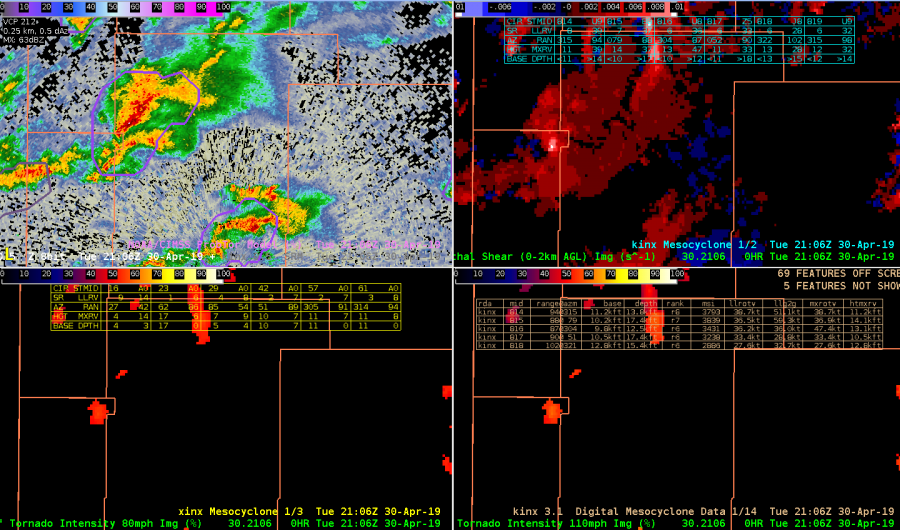
2106 UTC – just before storm merger see uptick in Azshear (0-2 km) with slight increase in CPTI products (50-52 %). DMD output not providing any useful information on these storms at this time probably. ProbTor ~ 10%
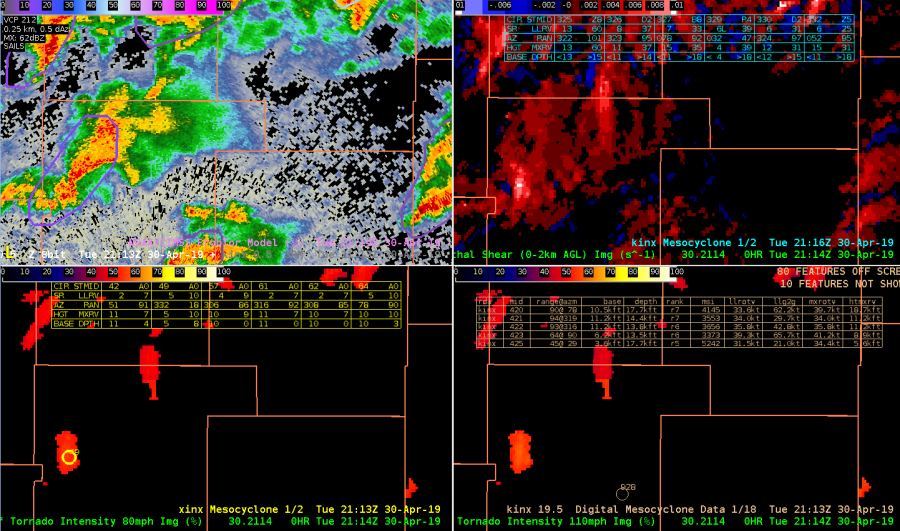
After merger @ 2114 UTC although not much change in AzShear, CPTI probabilities do increase some to 55 to 60%. Note that only the XDMD mesocylone algorithm displays a mesocyclone icon at this time while legacy DMD products do not.
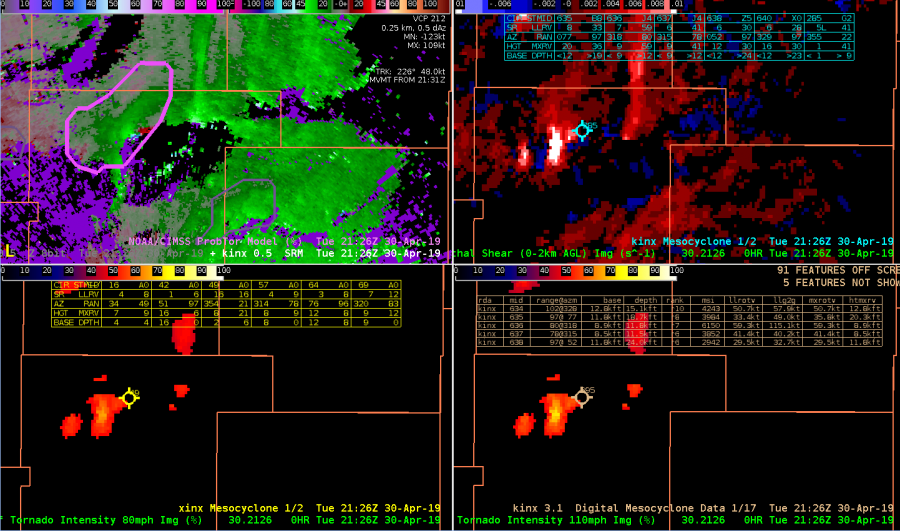
2126 UTC – ProbTor rapidly increased to 77% with marked increase in AzShear. CPTI products also near 70% (110 mph). Now all three DMD products display icon by this time. BUT the XDMD seemed to identify mesocyclone sooner than legacy products. This was encouraging.
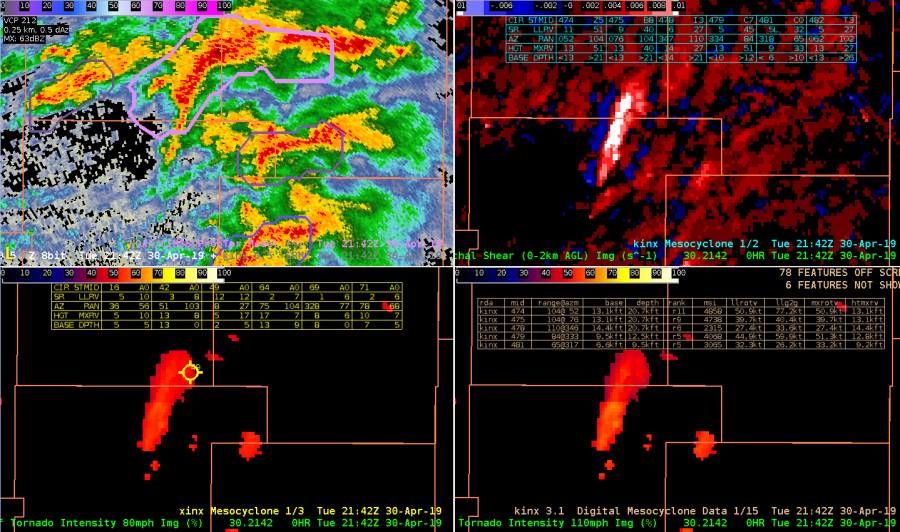
2142 UTC – looks like storm looses organization as inflow may have been disrupted. AZshear becomes elongated with CPTI values falling notably. Encouraging to note the character of AzShear (became elongated ) was consistent with the less organized storm (velocity structure). ProbTor falls to ~ 65%. Note the xDMD algorithm did still correctly identify shear couplet (SRM not shown) where legacy algorithm fails. XDMD performed much better and and had greater temporal continuity than legacy product in this example. In this more complex storm interaction example appeared XDMD was able to better identify and retain areas of shear/rotation compared to legacy.
-Quik TWIP