ProbSevere vs. LJDA

One of our primary goals today was to examine the relationship between the ProbSevere model and the lightning jump detection algorithm. A strong storm fired on the front range of the Rockies, just west of Denver. The ProbSevere model noted strong satellite growth rates in a moderately-sheared environment, with MESH only 0.17″. The probability of severe was 33% at 1920 UTC.  At this time the PGLM indicated a flash rate on the order of 6 flashes per minute.  Two minutes later, at 19:22 UTC, the ProbSevere was 46%, as MESH increased to 0.33″, and the total flash rate at 8 flashes per minute per pixel.   Over the next 4 minutes, two consecutive lightning jumps were indicated in excess of 2 sigma as the total flash rate rose from 8 to 20 flashes/min/pixel (2 sigma jump at 1922 UTC, 4 sigma jump at 1924 UTC).  ProbSevere increased to 66% at 19:24, and 77% at 19:26 (MESH = 0.71″).  This storm intensity information highlighted the rapidly developing updraft within the storm; signalling the potential for severe weather was increasing as the first storm in the area approached the Denver Metro Area.The NWS issued a severe thunderstorm warning at 19:36 UTC. The jump in ProbSevere (46% to 66% from 19:22 to 19:24 UTC) and the 2-sigma and 4-sigma jumps from the LJA (at 19:23 and 19:24 UTC, respectively) may be able to give forecasters enhanced confidence and perhaps more lead time to initial rapid development in the storm, and potential severe hazards. Animated GIFs for Flash Extent Density (top), Lightning Jump Detection Algorithm (middle), and ProbSevere (bottom) from 1920 UTC to 1930 UTC can be seen below.

FED_CO LJA_CO CO

Additional lightning jumps were noted at 1943 UTC (3 sigma) followed by multiple 2 sigma jumps at 2000 UTC, 2001 UTC, and 2004 UTC, and another 3 sigma jump at 2005 UTC.  These additional jumps were additional signals that the updraft in the storm was re-intensifying and continued to have the potential to produce severe weather.  Thus any warning that was issued should remain in effect. During this time period, ProbSevere remained at or above 98%. The first tornado report associated with this storm was at 2005 UTC and hail to the size of golf balls were reported in the Denver Metro.  Also hail depth of at least 5 inches was reported at Denver International.

In this case, ProbSevere and LJDA both displayed the rapid intensification of the updraft, and could be especially useful in identifying the first severe storm of the day, and the maintenance of the ProbSevere and additional lightning jumps continued to highlight the threat of severe weather as the storm continued eastward as the storm propagated eastward.  This information is a high temporal resolution (1-2 minutes) and provides additional data points that can fill gaps between radar volume times.

-JC,CS,BW


Same Storm Different Lightning Jump

jump_delay_2310_2338UTC

A secondary lightning jump occurs at 23:28 UTC with the same storm east of Denver Co. The lightning jump here reached the 2 sigma level when the total flash rate increased from 8 flashes per minute to 16 flashes per minute in the span of two minutes. This reinforcing lightning jump indicates that the storm’s updraft was still undergoing periods of intensification.  Baseball size hail was being reported at the time of the jump, and ping pong ball size hail was reported at 23:35 UTC in association with this storm.  Hail was reported as deep as 3 inches on the ground.

*There appears to be a delay between the jump occurrence in the Flash Initiation Density (23:28 UTC) and the LJA sigma plot (23:33 UTC).

PGLM, Lightning Jump, and Quarter size hail

lightning_jump_storm_4sigma_5sigma

Example lightning jumps from just east of Denver CO at 2251 UTC. The image above shows the lightning jump feature (shaded purple), flash initiation density (FID; pink boxes) and the meteogram output information.  The top two panels are the sigma levels at which lightning jump occurs, and the bottom panel is the total flash rate from the PGLM.   The Tracking meteogram outline is the white circles encompassing the storm.  Two lightning jumps occur at 2249 and 2251 UTC.  The first jump occurs as the total flash rate from the PGLM reaches 10 flashes per minute (4 sigma level; anything above 2 sigma indicates a lightning jump according to Schultz et al. 2011), and the second jump occurs with the larger increase in total lightning from 5 flashes a minute to 15 flashes per minute (6 sigma).  The jumps are indicating increases in updraft strength and volume,and can be used as a metric in storm intensification.  Quarter size hail was reported approximately 20 minutes later at 2310 UTC.

*note the flash rates are likely higher with this storm because the LMA used in this case only had 5-8 sensors active at any given time.*

Evaluating the Total Lightning Tracking Tool

Posted by Geoffrey Stano – NASA SPoRT

The 2013 Experimental Warning Program (EWP) has offered a great opportunity to test the NASA SPoRT / MDL total lightning tracking tool. Part of EWP’s efforts are to demonstrate future GOES-R capabilities, such as the Geostationary Lightning Mapper. This is being done with the pseudo-geostationary lightning mapper products being produced by NASA SPoRT in collaboration with seven ground-based total lightning networks. With total lightning observations (intra-cloud and cloud-to-ground) forecasters are looking for lightning jumps, or very rapid increases in total lightning activity ahead of severe weather. In the past, this has been done by visually inspecting the PGLM data. From previous evaluations by both SPoRT and the EWP, the number one request was for a way to visualize the time series trend of total lightning in real-time. With AWIPS II and the ability to create custom plug-ins, the first effort for this has been developed and is now here in operations at the EWP. One design feature was to make this a manual tool. In other words, it is the forecaster who selects the cell track and not an automated tracker, which traditionally has difficulty with merging and splitting cells or not activating at the proper time. Once the forecaster places two points, the tracker activates and will create a track based on these points.  Each point can be moved individually to adjust the track and the tracker will attempt to maintain the track as new data are ingested.  We wanted to evaluate the utility of the total lightning tracking tool as well as its impact on operations. In only a couple days, the feedback has been great. First, here is an example of the PGLM with the total lightning tracking tool this evening.

The PGLM flash extent density observing a maximum of 50 flashes with the total lightning tracking tool time series (pop-up to left).
The PGLM flash extent density observing a maximum of 49 flashes with the total lightning tracking tool time series (pop-up to left).  The lightning jump can be seen early in the time series as it goes from 20 to 49 flashes in two minutes.

Overall, feedback has been very positive as forecasters have  appreciated being able to visualize the time series instead of creating a mental picture.  Also, the time series plot is pinned to always be on top, which prevents it from being lost behind the D2D display.  Also, the feedback has been very constructive to help improve the look and provide ways to minimize the time impact.  Some of the commentary has focused on modest improvements to the layout and look.

  • Add a minimize button to the time series display pop-up.
  • Have the time series trend color match the active cell point color for the track.
  • Have a way to change the default size of the cell point radius of influence (which determine how much lightning data to query).

The feedback also has included very interesting options to save time in implementation.

  • The tracker initiates after two points are plotted.  However, it attempts to extrapolate the cell track after placing one point.  This results in the cell points being very spread out.  Suggest waiting to extrapolate the track until after two points placed.
  • Also, when the storms are more discrete, instead of using individual cell points created a small “domain” around the storm cell of interest.  The forecaster selects a “polygon” of where the storm will be and the tracker selects the PGLM value within this domain at each time step. This may be able to be done by using the tools similar to how forecasters plot a warning polygon as well as how that can be edited.  Furthermore, the storm motion could be added to further aid the plot.  The big advantage here is that this polygon may be much quicker to place than several individual cell points.

All of these are very good suggestions and this feedback will be taken back to see what can be implemented. The polygon suggesting is very interesting to consider, while the current cell point method would be most viable in a multi-cellular environment.  Additionally, this feedback has been very useful in that it helps refine the total lightning tracking tool ahead of its next evaluation as part of the Operations Proving Ground later this summer.

Tomorrow should be another good day to gather additional feedback.


LJA: nearing end of experimental period & data collection update

Finally, a bit more activity in some of our domains this week.  In the last couple hours widespread severe (and near severe) storms have developed across the WTLMA.  Activity is expected to continue in the SW OKLMA network and possibly central OK later tonight.  SHAVE is currently actively calling in the region west and NW of Lubbock, reporting primarily pea-to-dime-size hail (severe winds are likely to be a larger factor with these storms) .

lightning jumps WTLMA

Above image is screen capture of realtime webpage active using google maps at 2231 UTC on 26 Sept 2012. Storms with jumps are noted, image shows timing & flash rate at that time (total per min & CG per 5 min) for storms tracked using Scale 1 (data for storm tracking at smaller and larger scales also available). SHAVE data collection points are denoted by green (0.25-0.75 in hail) and grey (no hail) circles.

Data collection update:

17 Sept 2012: NALMA 2000-2200 UTC (severe possibly out-of-range)
18 Sept 2012: DCLMA 1430-2230 UTC
25 Sept 2012: OKLMA 2300-0400 UTC (SHAVE data available)
26 Sept 2012: WTLMA/ OKLMA 1900 – ? (SHAVE data available)

LJA: multi-scale tracking & data collection update

Relatively quiet weather has continued over the domains during the last week. Today’s event over the NALMA is likely to be primarily a heavy rain event, but it’s still a good opportunity to show how the same storm system is tracked simultaneously at different scales. For the LJA, we are running 3 scales concurrently: scale 0 (200 km^2 min cluster size), scale 1 (600 km^2), and scale 2 (1000 km^2):

Scale 0 over the NALMA domain. Clusters are the regions identified by the colorful shapes over the reflectivity at -10 C plot.
similar to the previous image, except for Scale 1.
similar to the previous images, except for Scale 2. At scale 2, the identified storm clusters are allowed to grow unbounded.

(severe, or near severe) events since last update:

8 Sept 2012: DCLMA, 1600-2200 UTC

Lightning Jump Data Collection Summary: 31 May 2012

An earlier post summarized the first month and half of data collection, the details below will bring us through the end of May.

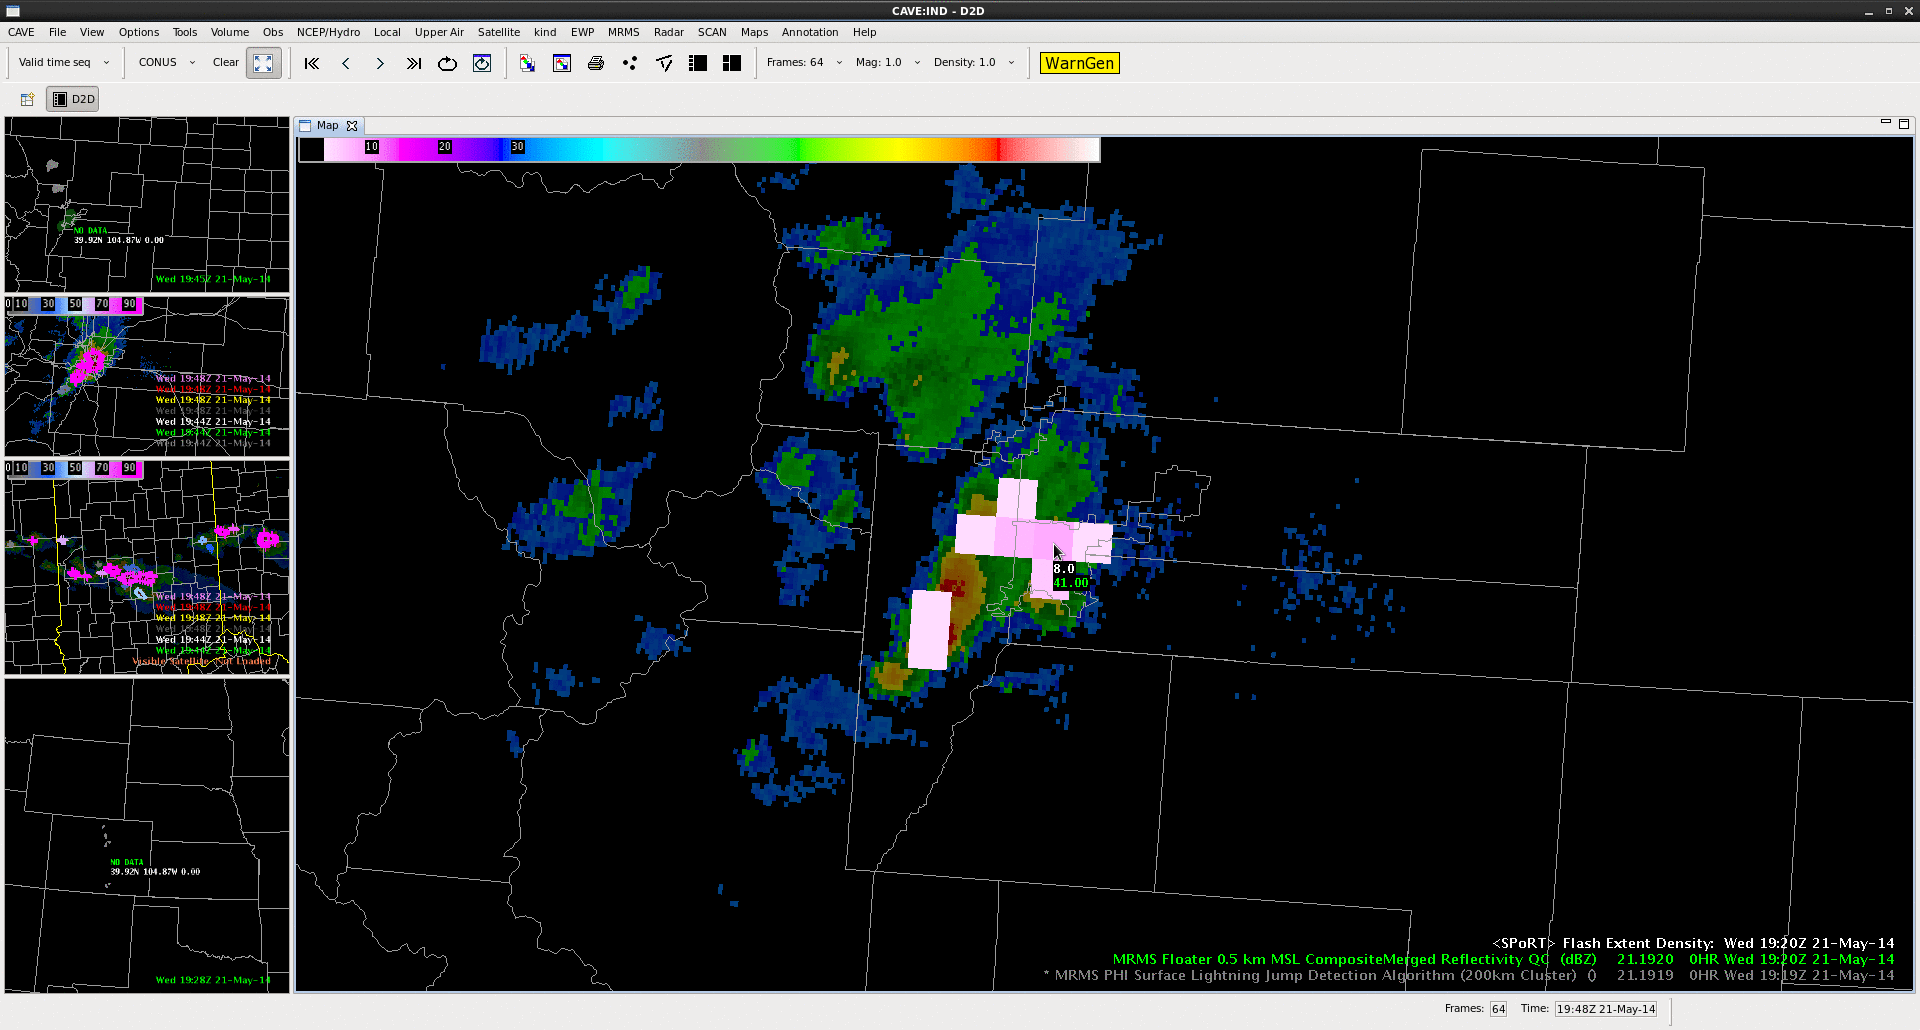
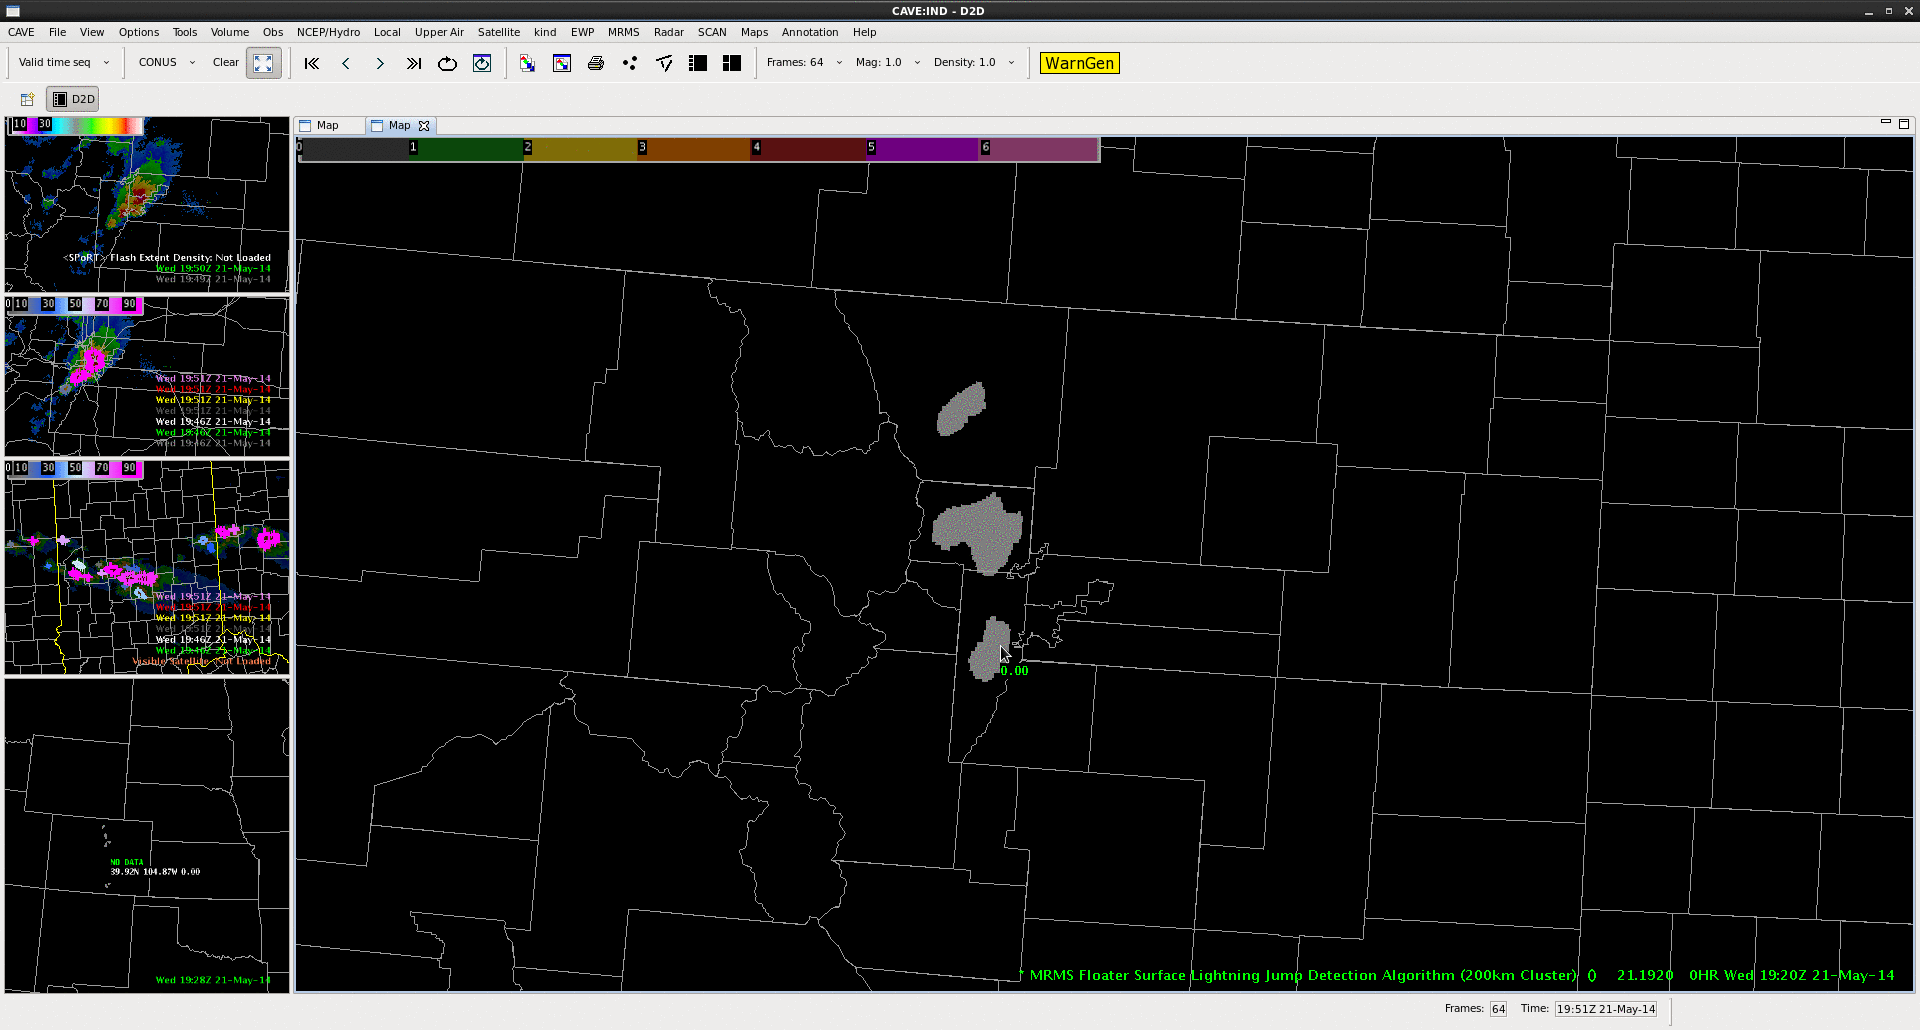
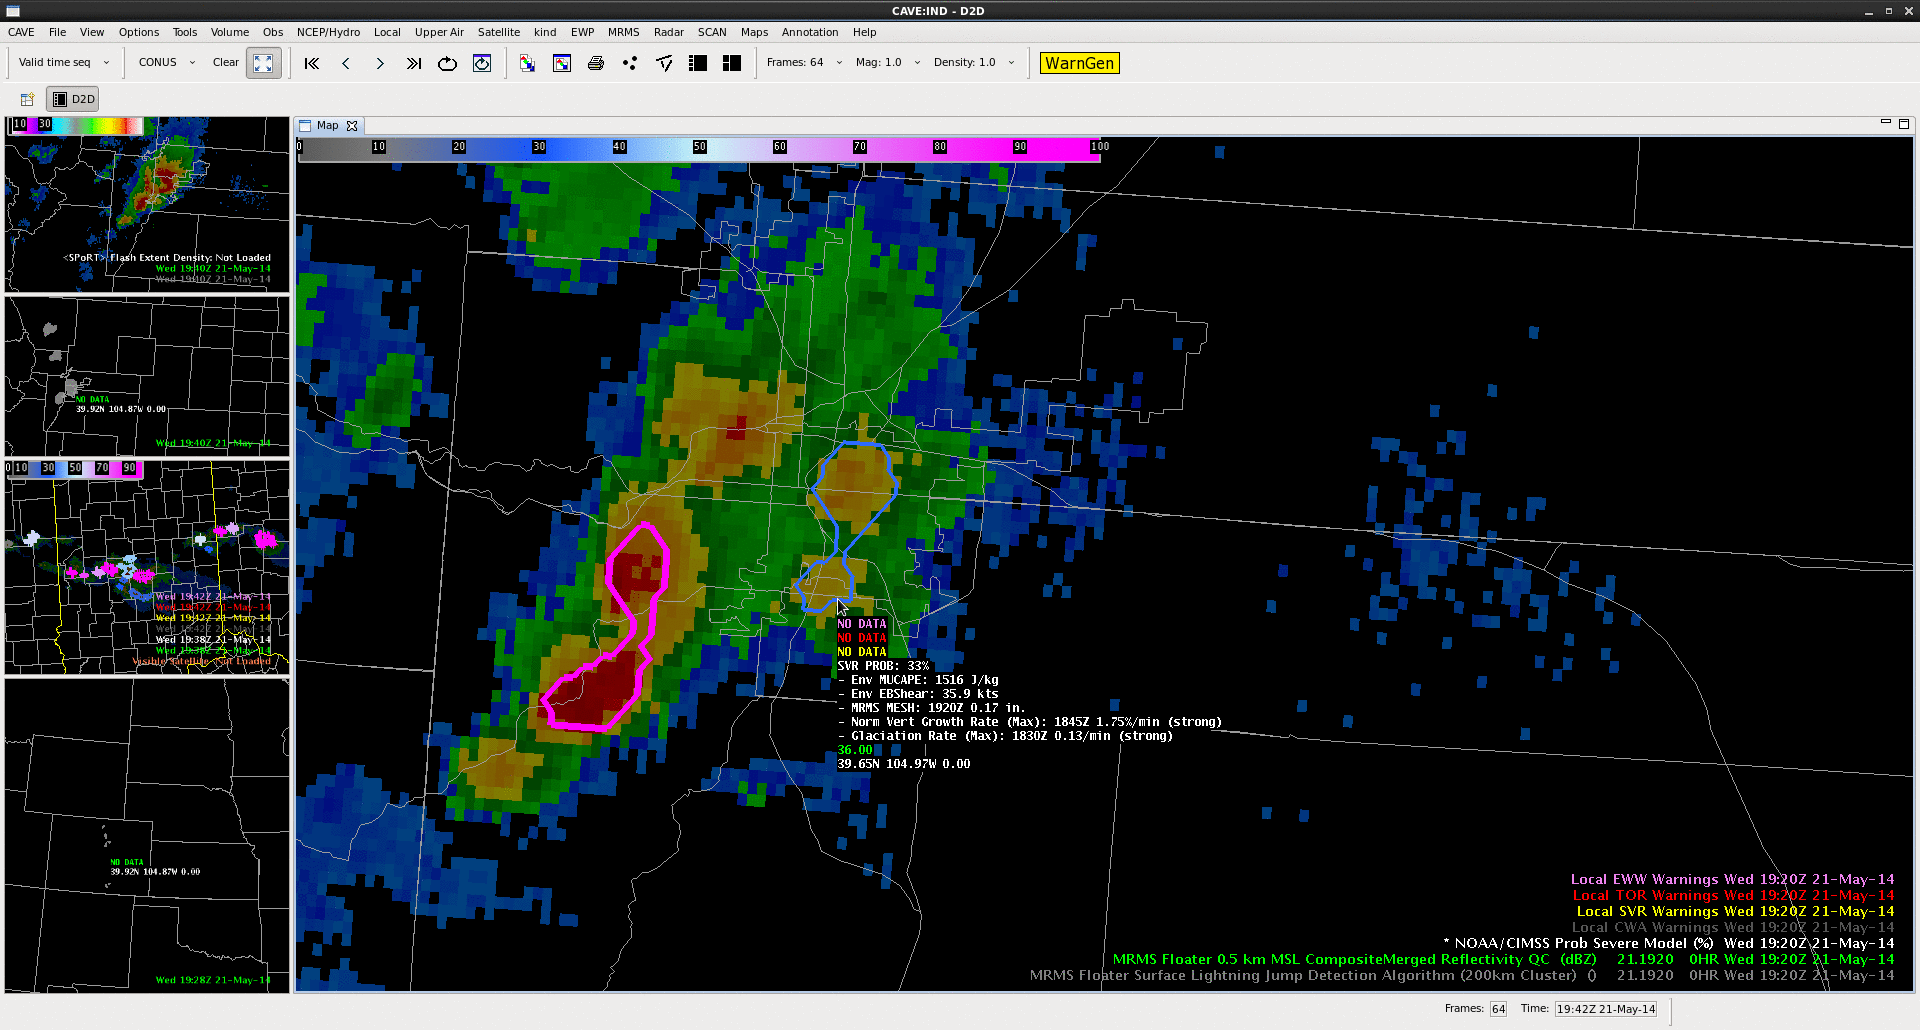
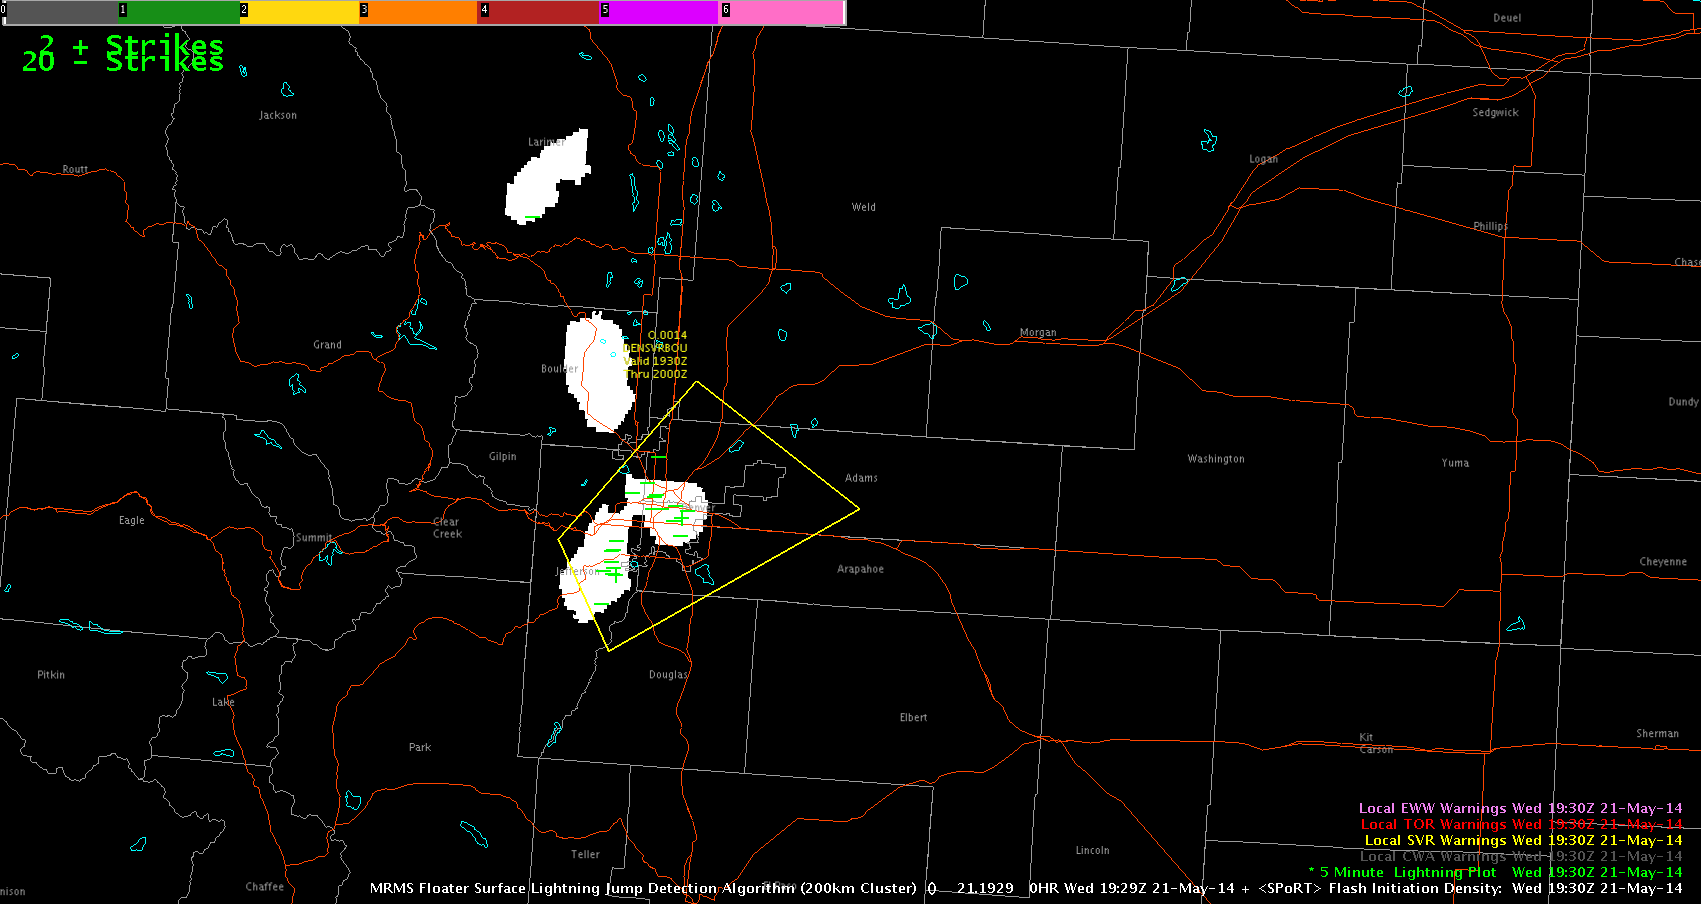
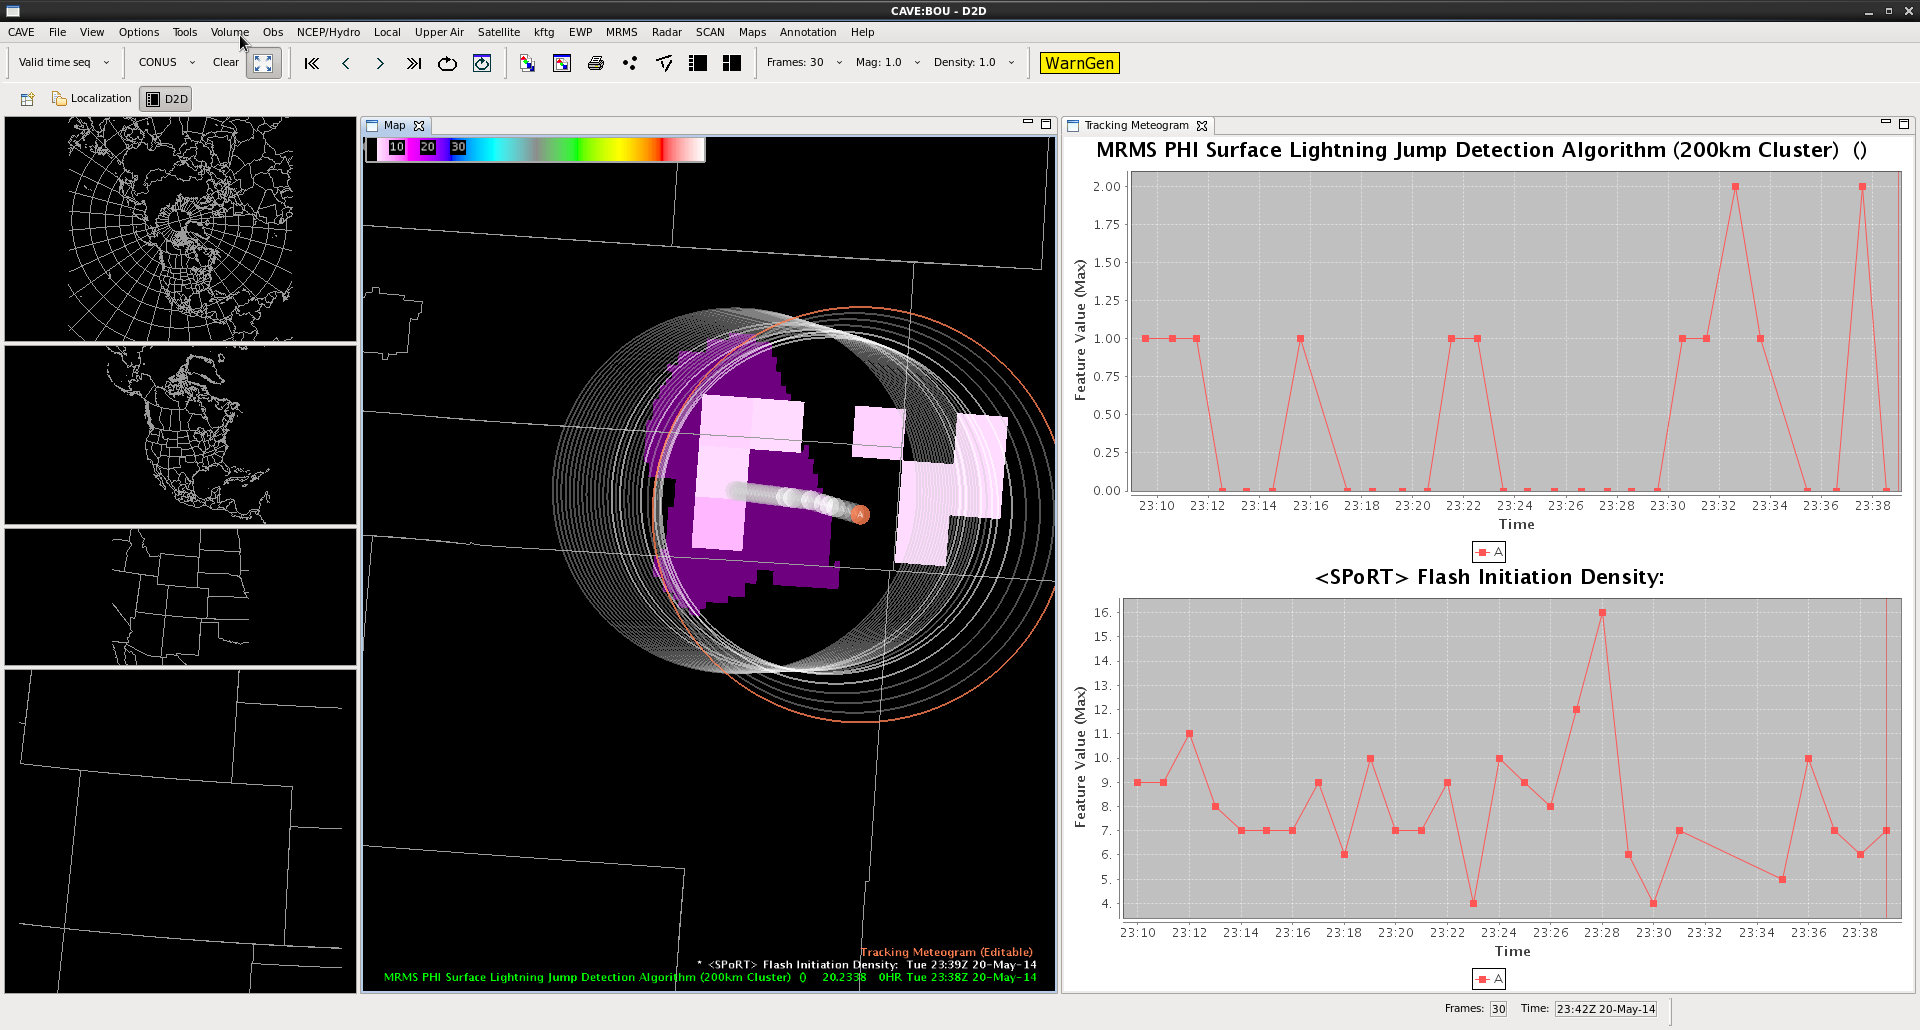
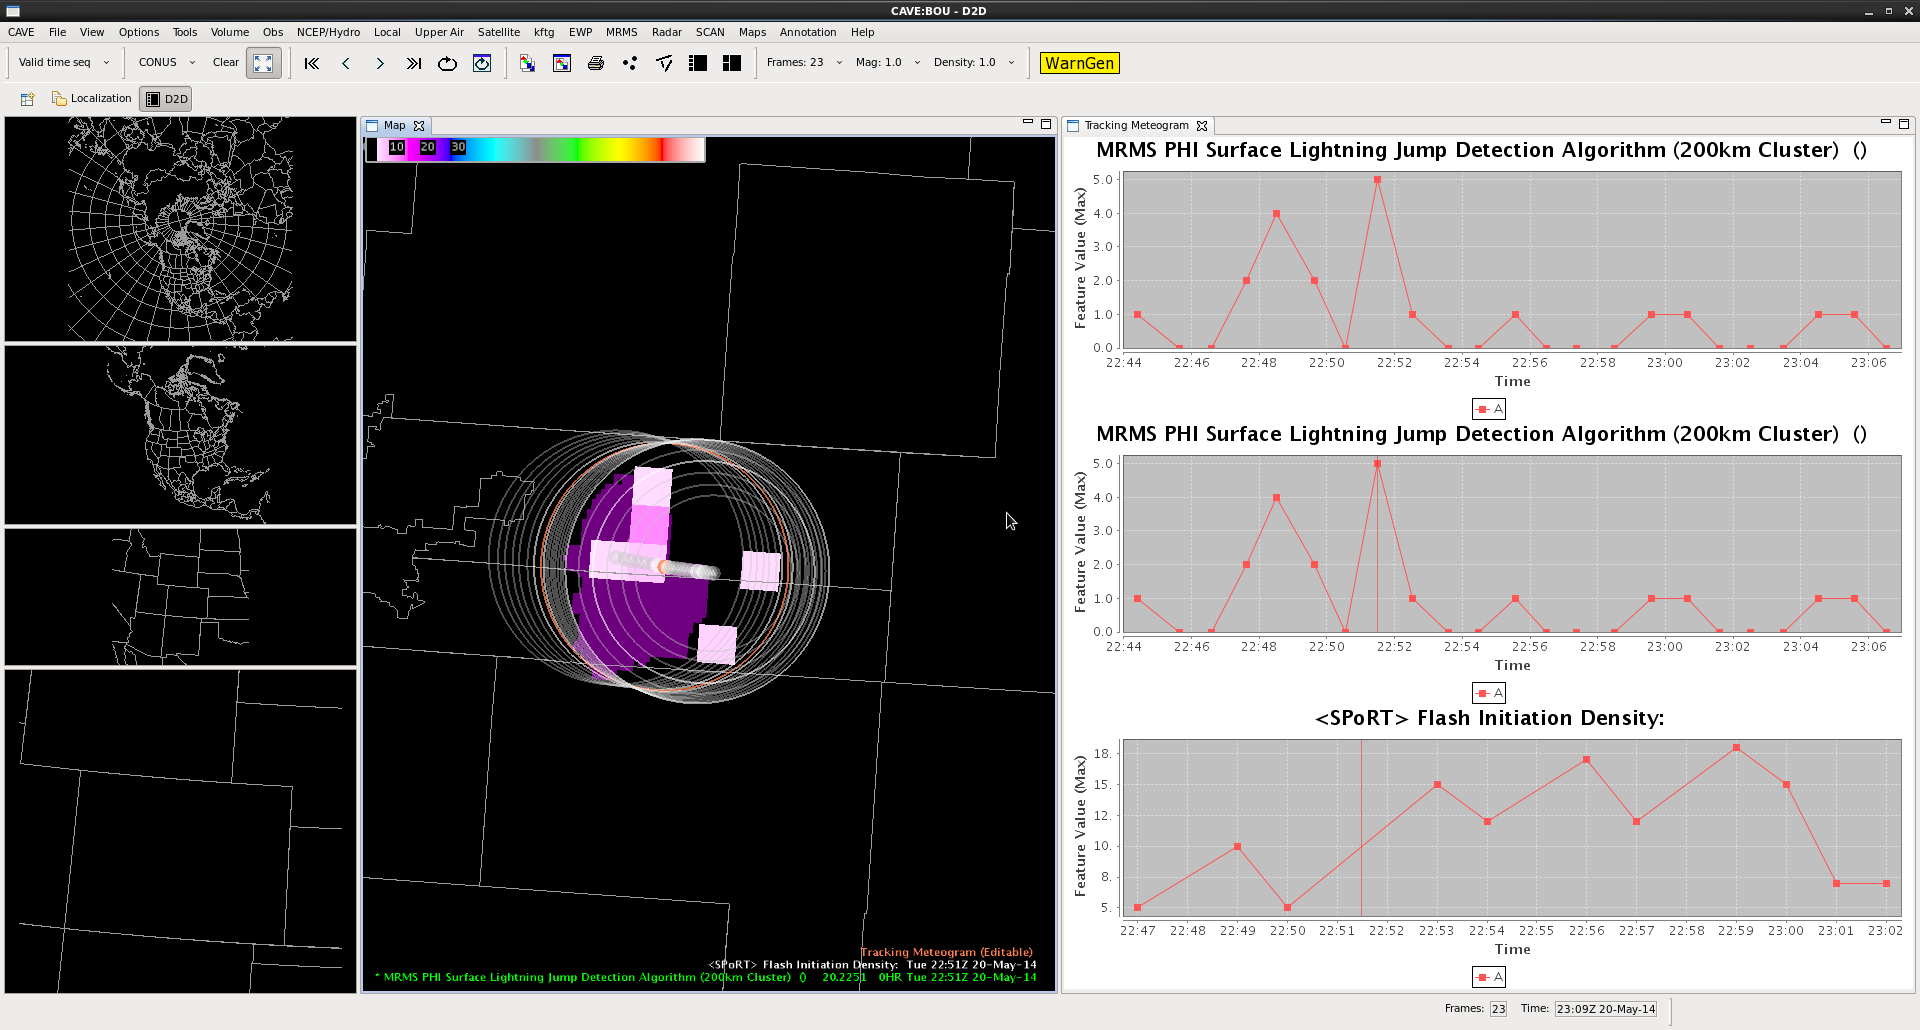
Note: All times are approximate to include timing of any severe or marginally severe weather in the domains.  Re-processing and analysis should start prior to first time listed here. SHAVE details are included for dates that I personally know they collected data over the domain.  Dates without “SHAVE ops” listed may also have SHAVE data, please check directly with Kiel Ortega if you need it for analysis.

17 May 2012: FL-LDAR, 2230 UTC – 0100 UTC (18 May), SHAVE operational

19 May 2012: OKLMA, 2200 -0800 UTC, SHAVE ops in OK domain

20 May 2012: OKLMA (maybe, on edge of 3d); 2100 – 2230 UTC

24 May 2012:  DCLMA, SHAVE ops in NWS Sterling, VA (LWX) County Warning Area (CWA)

25 May 2012: OKLMA (maybe, on edge of 3d); 2300-0200 UTC

27 May 2012: DCLMA, 2340-0200 UTC

28 May 2012: OKLMA, 2200-0300 UTC

29 May 2012: DCLMA, 1820-2230 UTC; OKLMA, 1900-1130 UTC; NALMA (2330-0300 UTC); SHAVE ops in LWX and OUN CWAs.

30 May 2012:  WTLMA & OKLMA, 2100-0400 UTC. SHAVE ops in OUN CWA

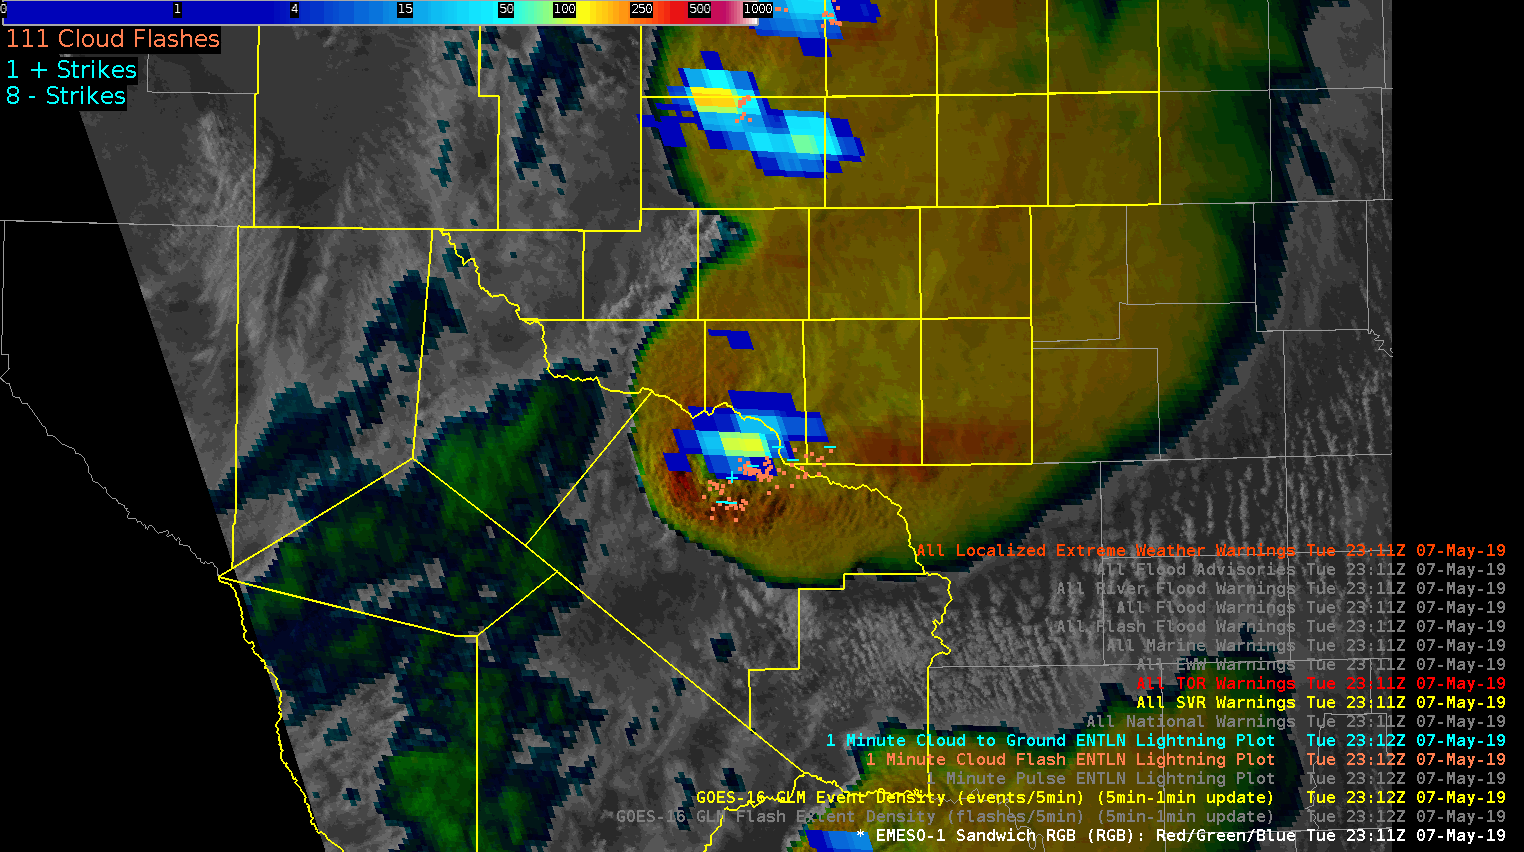
31 May 2012:  NALMA likely. SHAVE ops planned over area. (edit, 5:35 CDT: FL-LDAR domain has had activity &  jumps today)

-K. Calhoun