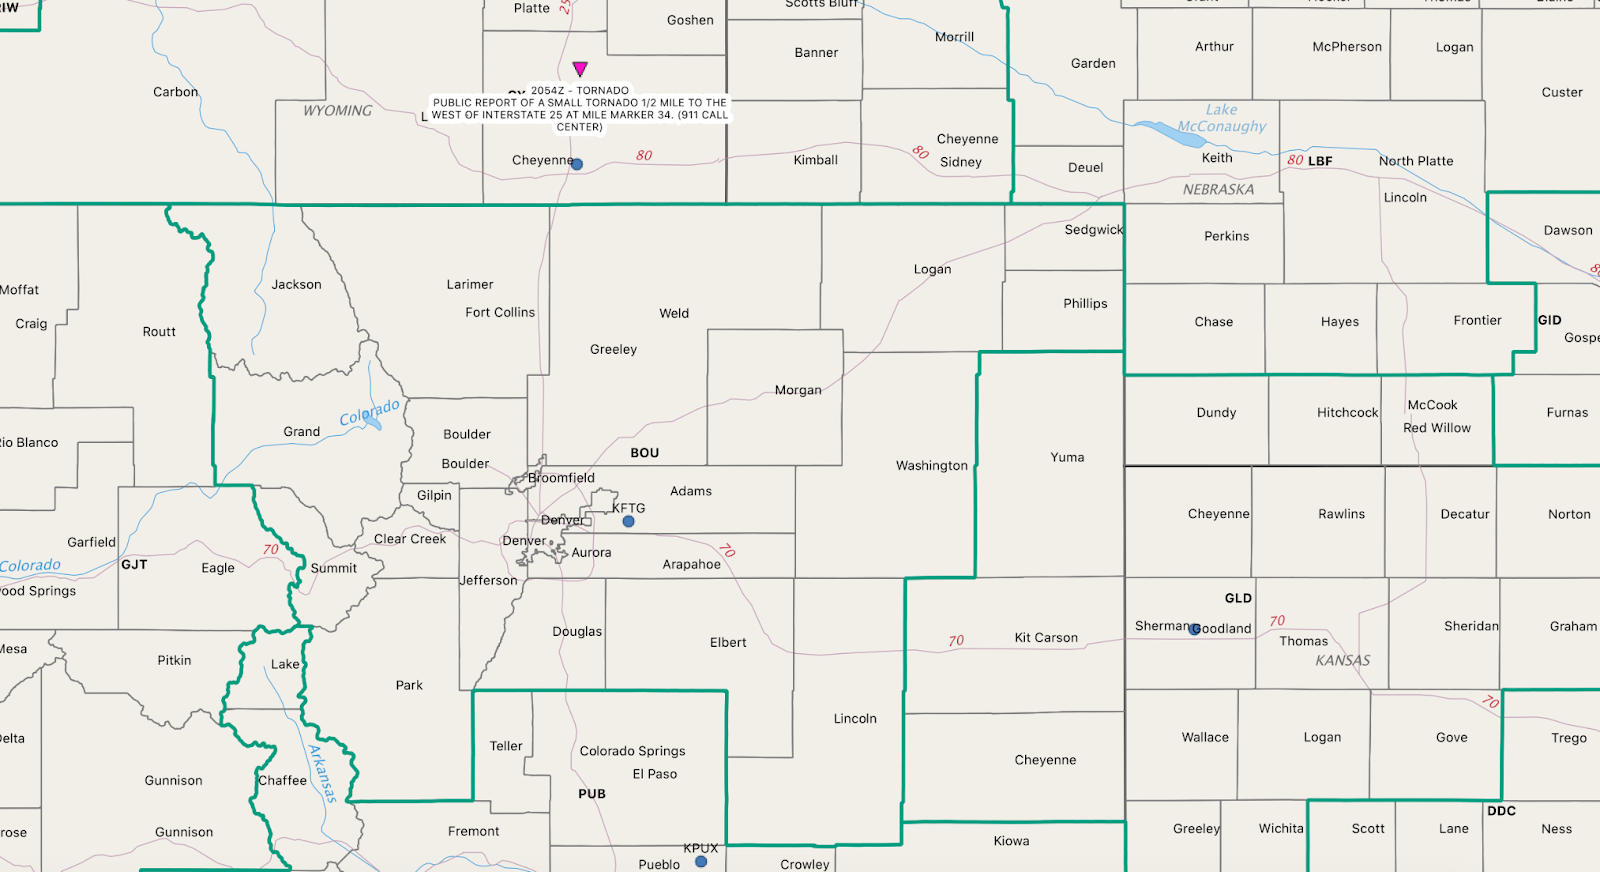
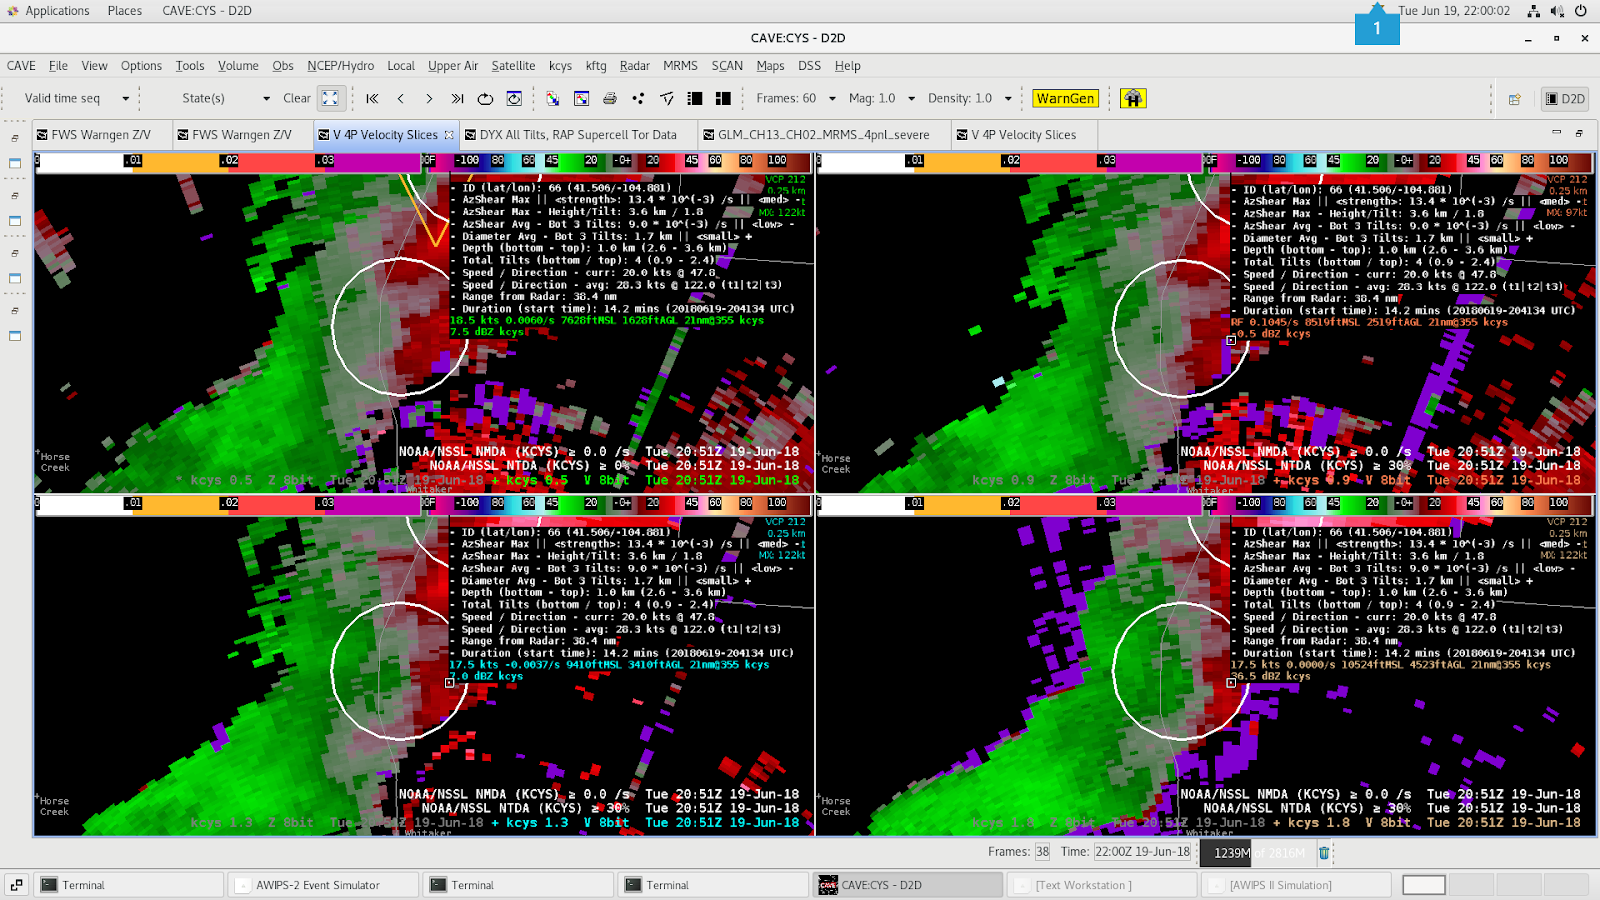
There was a public report of a small tornado just east of I-25 in CYS’s forecast area at 20:54Z. Base velocity data from the KCYS radar was pretty unimpressed showing some weak rotation at 20:51Z. The NTDA didn’t have a detection with it but the NMDA was detecting a meso with a medium azShear Max and low azShear Average. The stronger rotation was above the 0.5° with the NMDA triggering on the 0.9 to 2.4° tilts. I’m unsure that would have provided enough confidence to issue a tornado warning. But the NMDA could’ve given some clue to the potential for a tornado. There was no SAILS data for this event, so maybe if we had additional 0.5° scans then we would have seen a stronger rotation signal in the base velocity.
PUBLIC REPORT OF A SMALL TORNADO 1/2 MILE TO THE EAST OF INTERSTATE 25 AT MILE MARKER 34 | Laramie County | 25 miles N of Cheyenne0.5, 0.9, 1.3 and 1.8° tilts from the KCYS radar at 20:51Z.
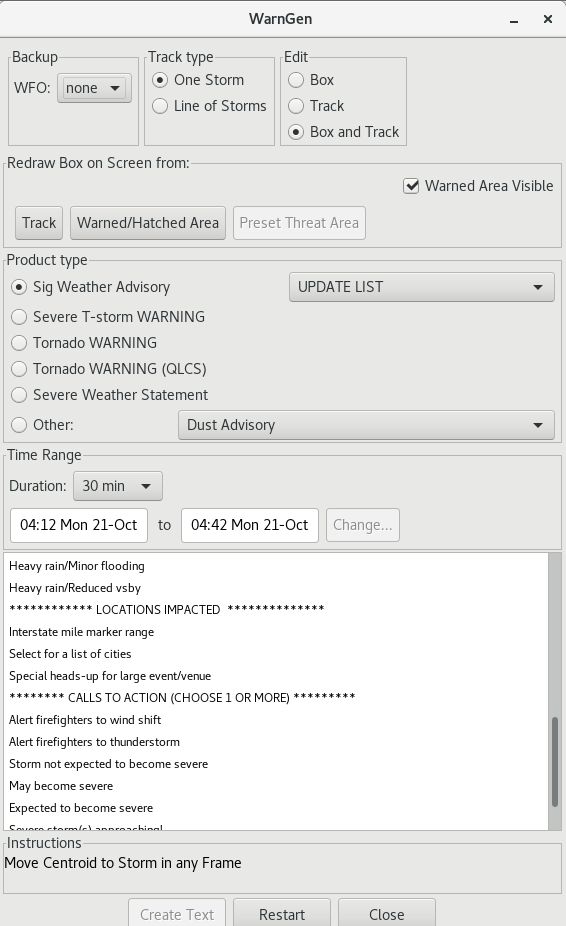
I became bogged down with WarnGen and the GUI with this event and it took away from some of my situational awareness. I issued a few Tornado Warnings with the KOUN WarnGen GUI but it was customized differently from the previous several cases and real time events. I liked the Tornado Warning (QLCS) option, but the re-arrangement of the product types and the attributes threw me off. I did toggle on the TLX or Tulsa option in the WFO knob to get back to reality a bit (Fig. 1). I also had issues with the Track and Box. I got a speed of 605 mph. A new record. I did not issue a warning until I got the speed back to 35-50 mph.
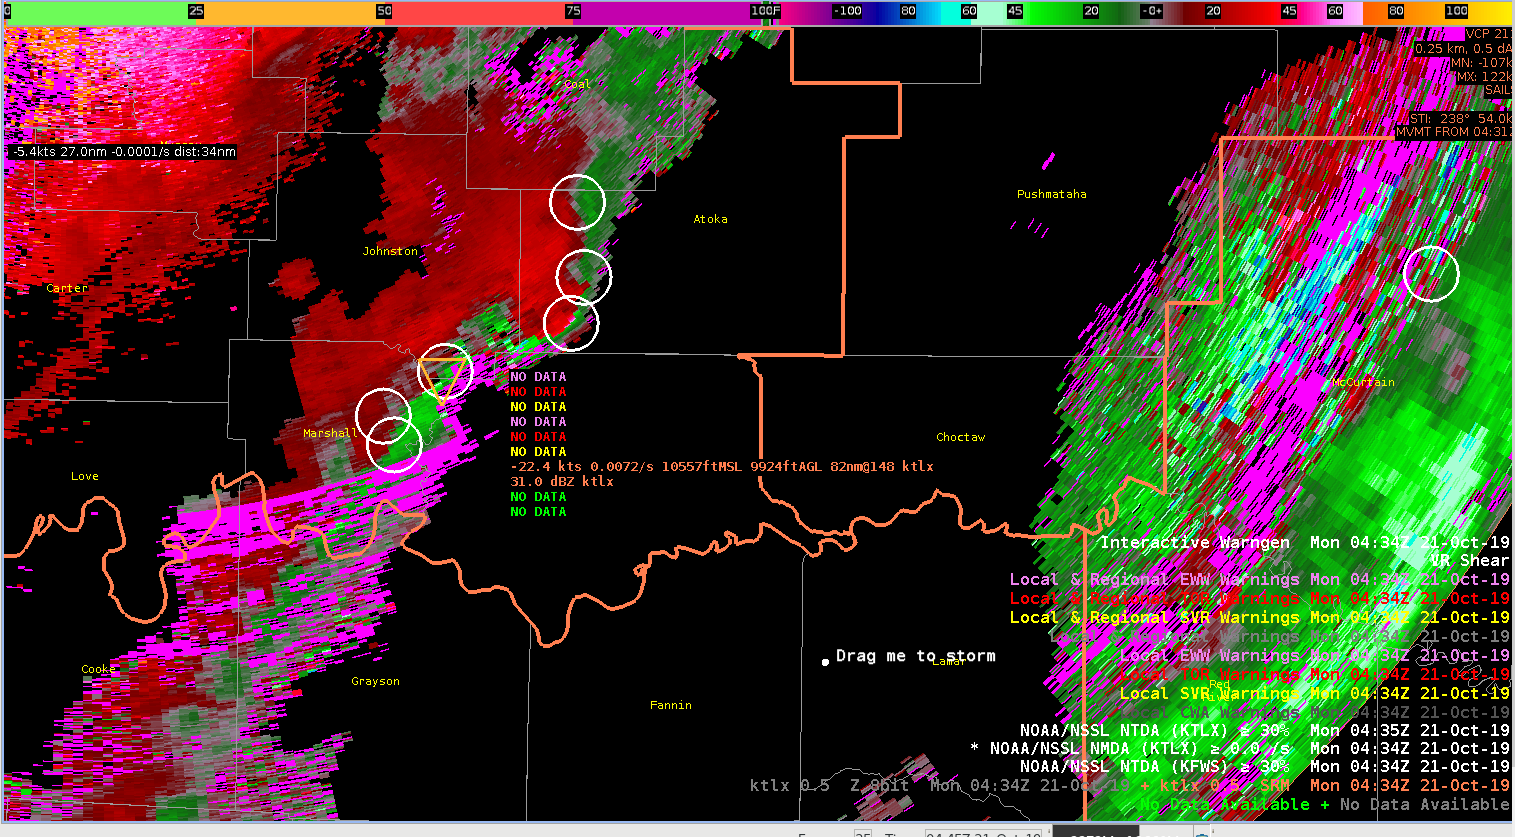
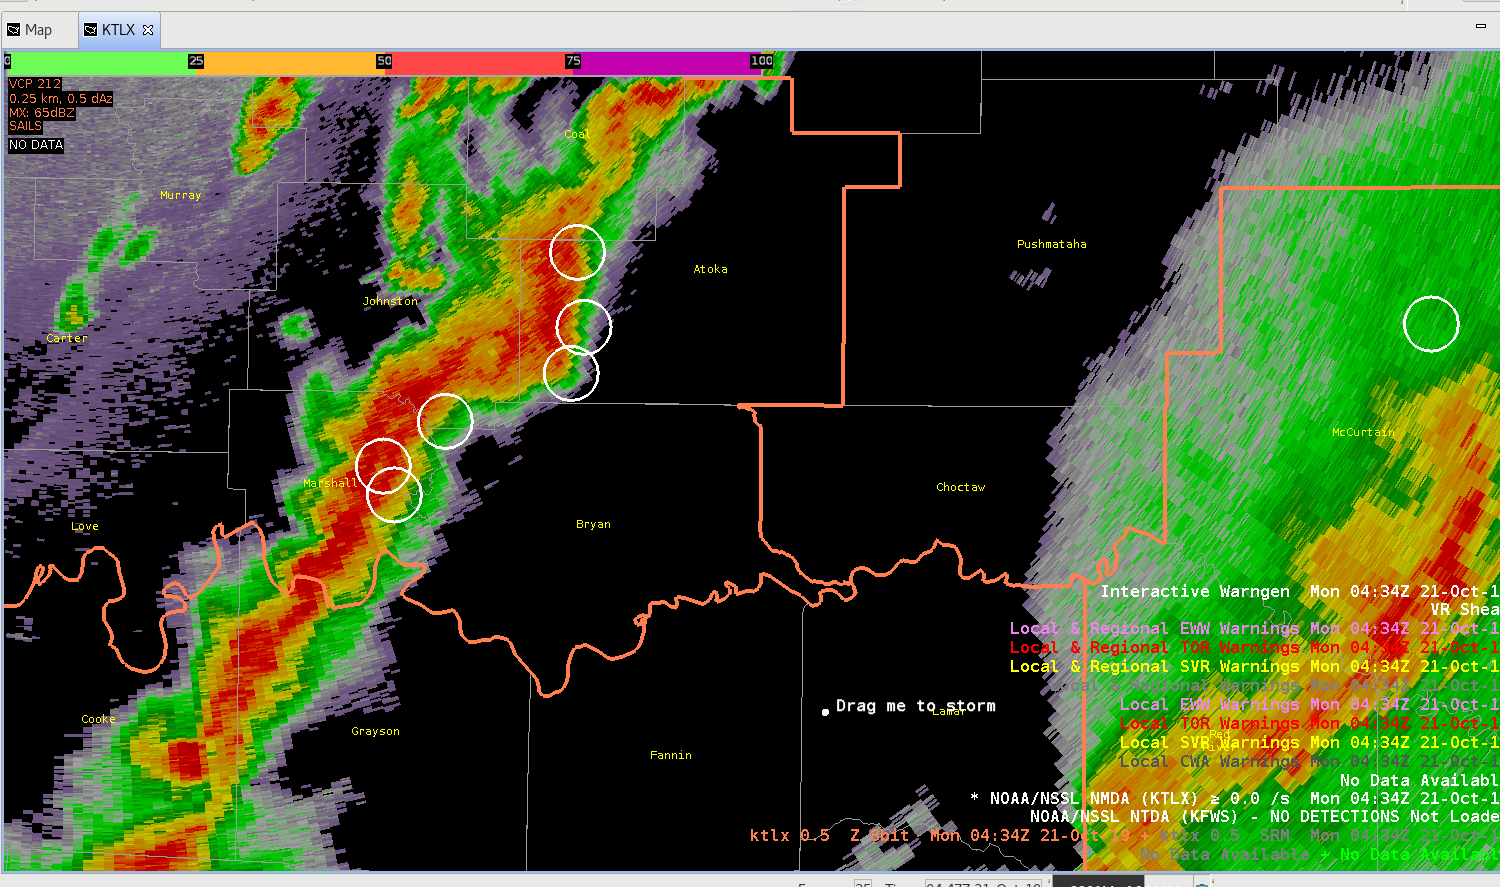
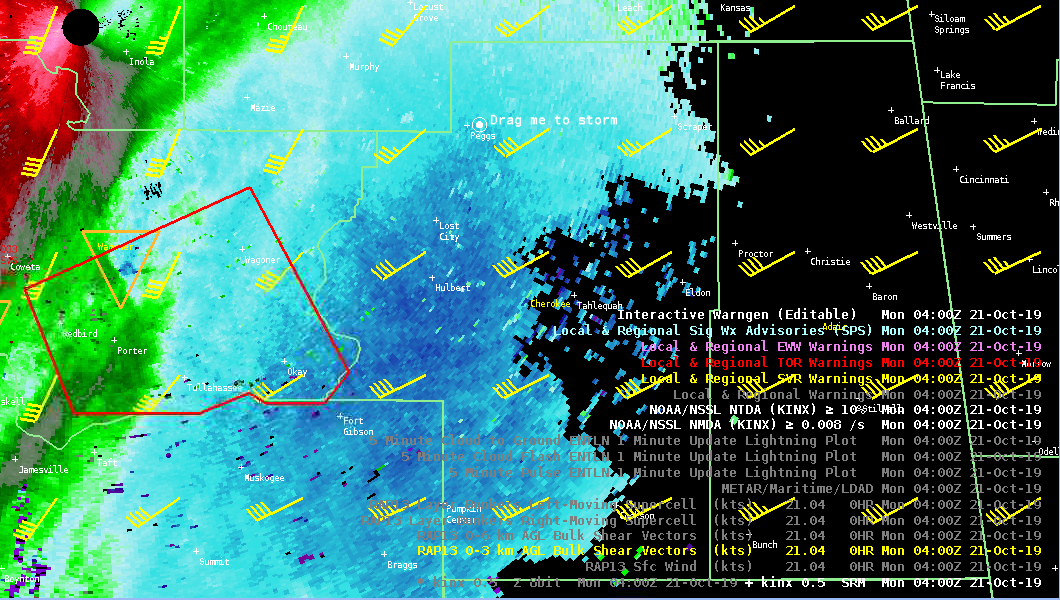
I switched primarily to SVR mode with TOR tags after I issued a few TORs as the warnings were not verifying. I lowered the NTDA probs down to 20% thinking more TORs may be needed with maybe 40-60% probs. I forecasted incorrectly with this. I likely should have decreased the NMDA to the bottom threshold to reduce the numbers of MESOs detected. See the bottom two figures (Fig. 2 and Fig. 3) . I likely should have issued a few TORs here late in the event for the south side of the line. This would have been between 0430-0500 UTC.
Fig. 1: KOUN WarnGen GUIFigure 2: 0434 UTC 21 OCT 2019 KTLX 0.5 DEG SRM, NMDA, NTDA, and Warnings.Figure 3: 0434 UTC 21 OCT 2019 KTLX 0.5 DEG REF, NMDA, NTDA, and Warnings.
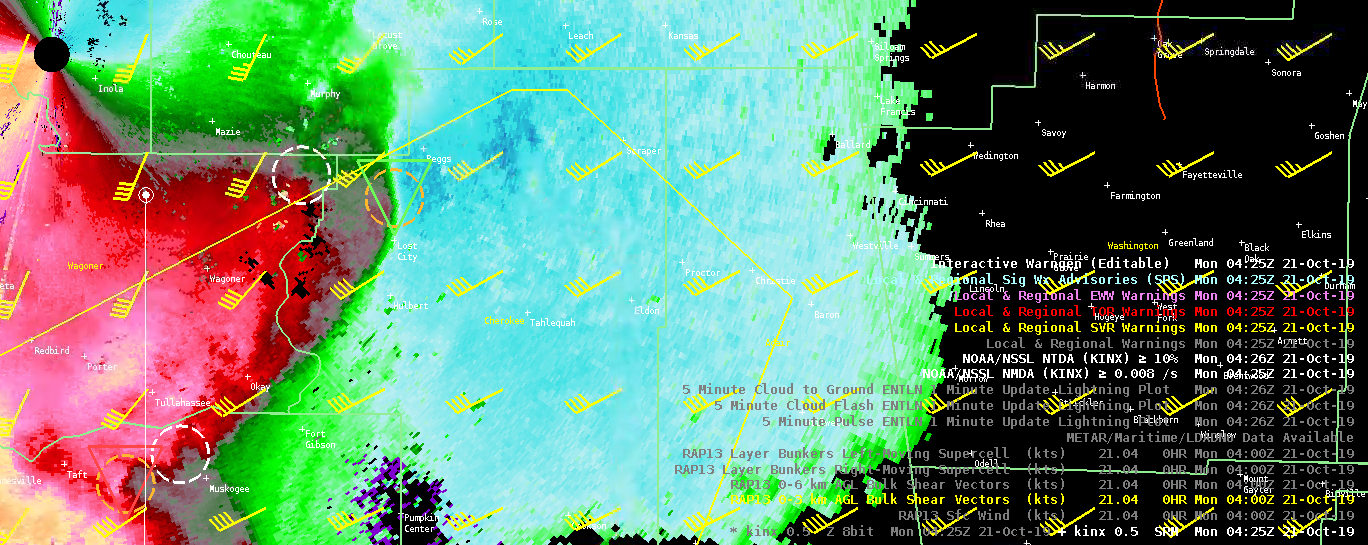
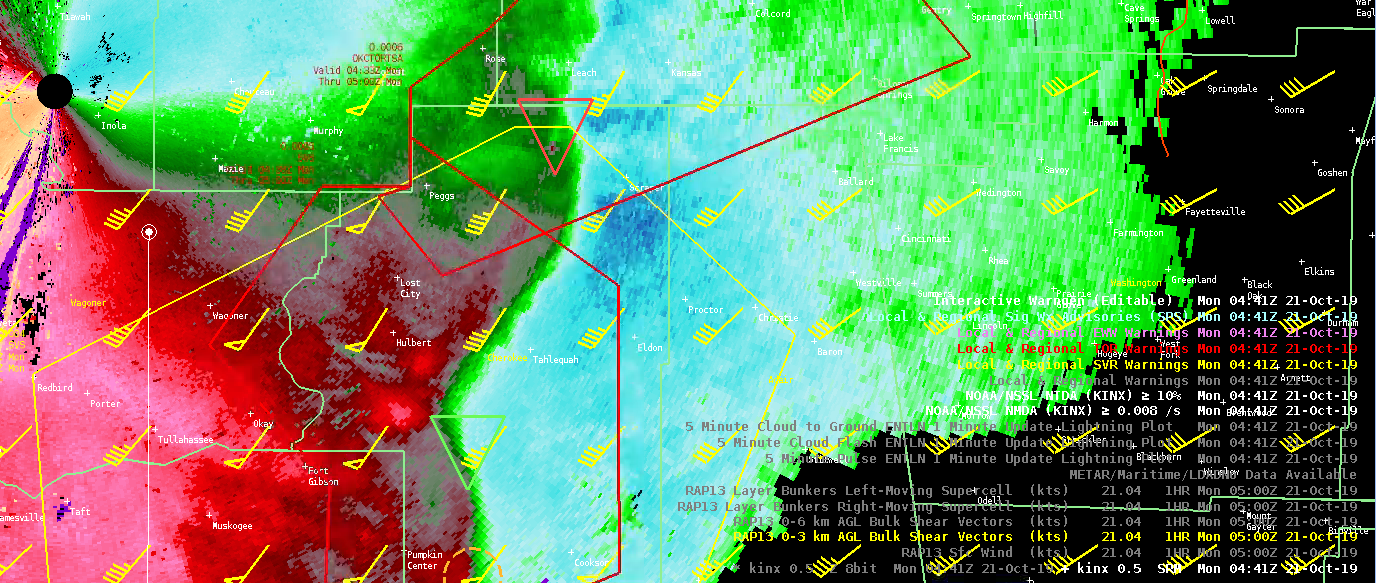
A QLCS system developed across Tulsa CWA and moved ENE to NE. Using the three ingredients method, along with the two algorithms, allowed me to get about 10 min lead time on a QLCS tornado in northern Cherokee Co.
KINX 0425 – Around the time both algorithms picked up on rotation. NDTA 21%, NMDA – mod (3 tilts)KINX 0430 – Both algorithms showing increasing trend. Tracked object really well. NDTA 28%, NMDA – mod (10 tilts)
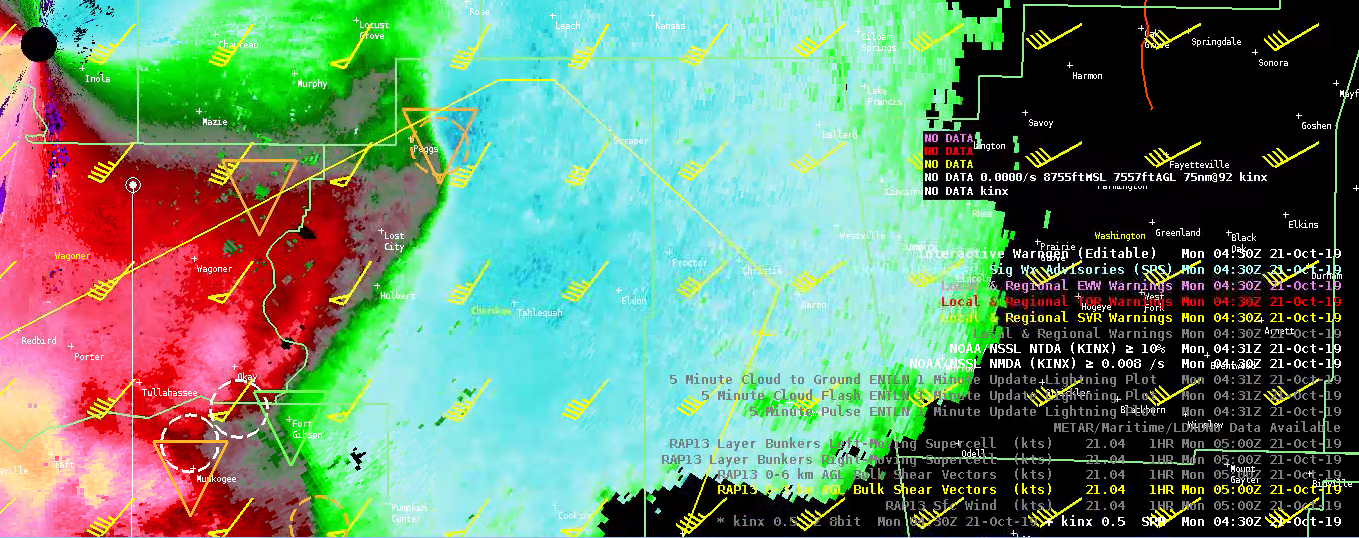
Tornado warning was issued at 0432Z.
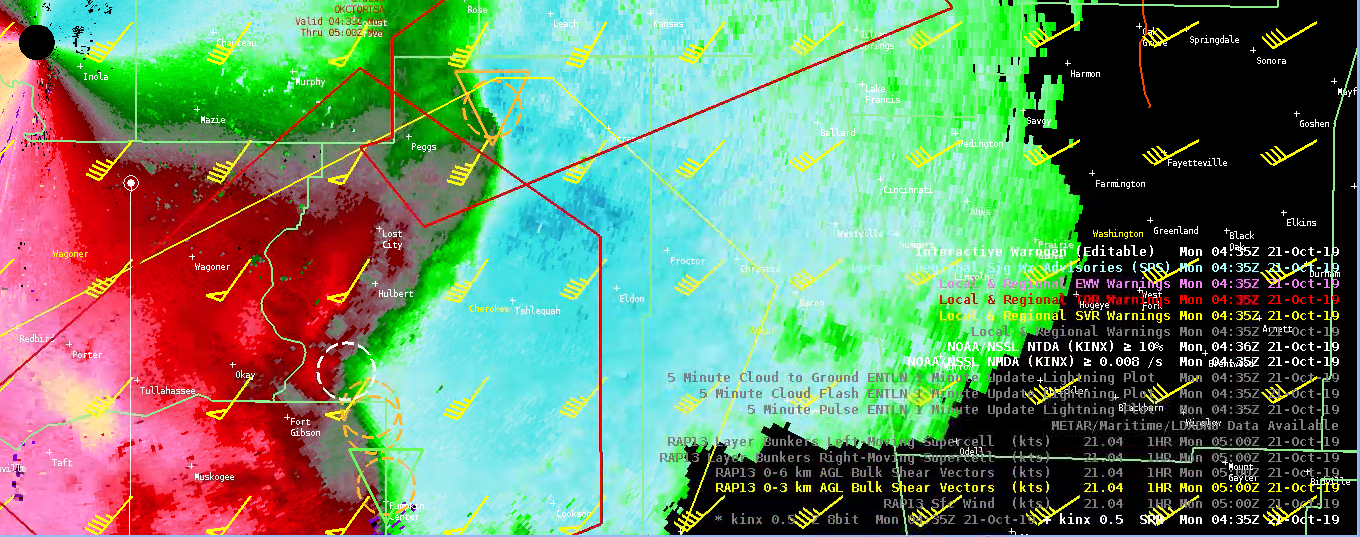
KINX 0435 – NDTA 36%. NMDA still showing moderate rotation (5 tilts)KINX 0441Z Around the time of the tornado – NDTA 52%. NMDA still showing moderate rotation (frame before) (10 tilts)
Over the course of the week, I’ve found that co-located detections (NMDA and NTDA) along with steady or increasing intensity trends in both, have given me increased confidence to issue or continue downstream warnings. While the NTDA probabilities can be somewhat low, at times (esp. QLCS systems), the monitoring the trends in the intensity output has been very valuable to me. Some sort of visualization of the trends (similar to ProbSevere) would be extremely helpful.
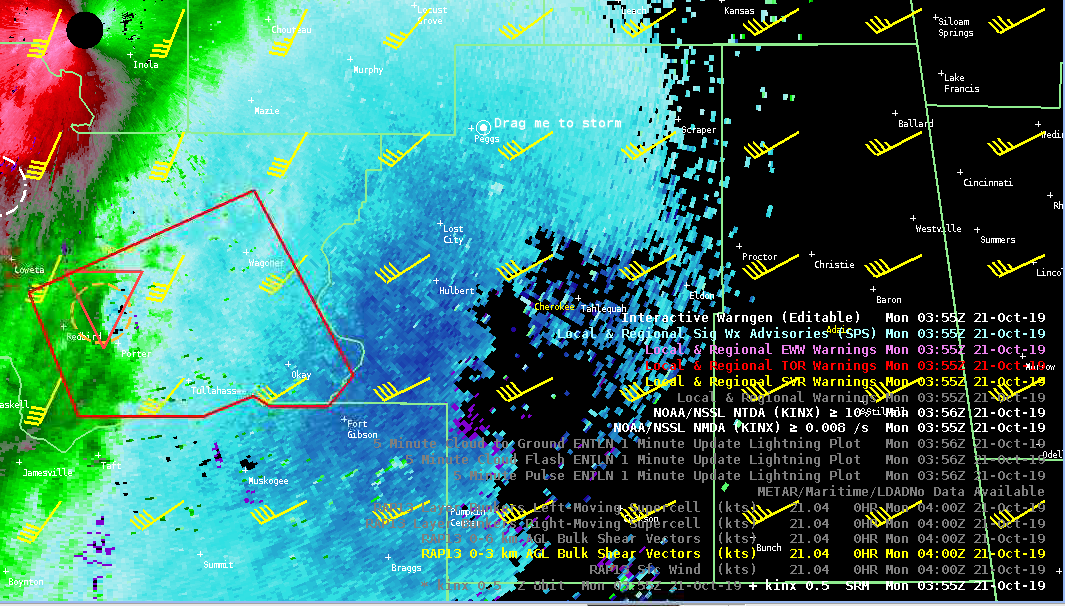
Earlier, the combination of the NMDA, NTDA, and three ingredients method gave me confidence to continue a tornado warning downstream of a current warning.
New Tornado Warning was issued between 0400Z to 0405Z and there was a tornado LSR
There was another QLCS tornado earlier in the event in which the NTDA showed quick and substantial increase in probabilities – 39% @ 410Z, 43% @ 412Z, 67% @ 413Z, 59% @ 415Z. This didn’t really provide much lead time as I was a little late on the Tornado Warning, but the probabilities behaved as they should have.
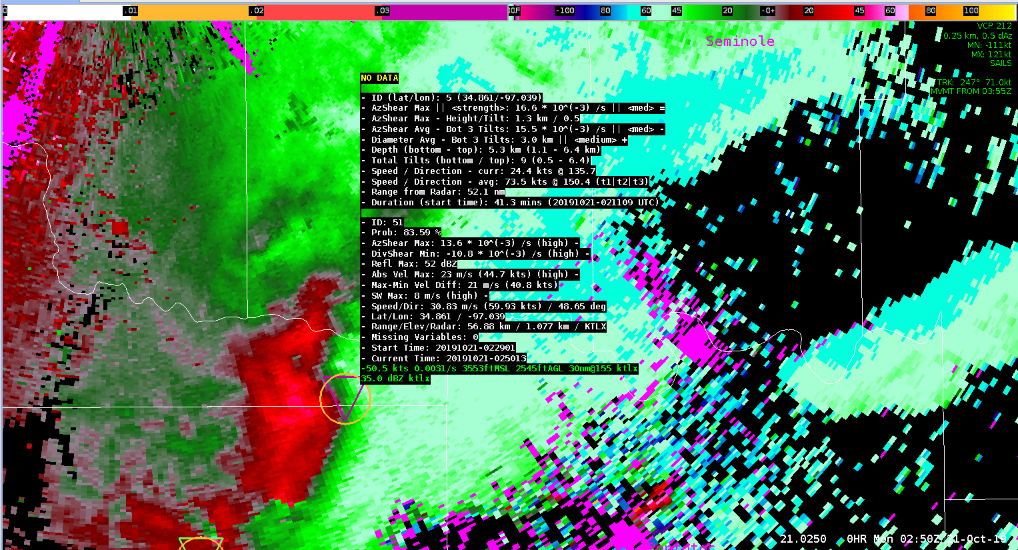
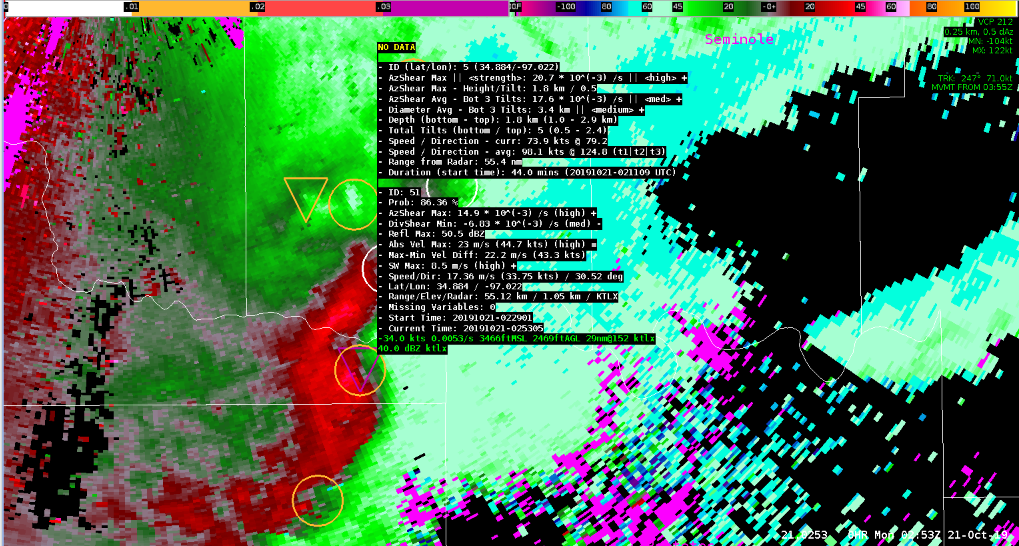
This was a great example where both the NTDA and NMDA algorithms acted as a confidence nudger for a warning decision – ultimately resulting in positive warning lead time ahead of a tornado. Interrogating a local surge in a line of severe thunderstorms southeast of TLX at 0250Z, this area was a prime focus for potential tornadogenesis given line-normal 0-3km Bulk Shear of ~40kts according to RAP13KM data (using the Three Ingredients Method). Scanning aloft quickly, a tightening mesocyclone was in progress which led to a tornado warning decision. By this time, I did notice quickly increasing trends in NTDA probabilities (83.59% at 0250Z, 86.36% at 0252Z) which by this time, I was already beginning to draw the TOR in Warngen. Seeing this display update while drawing the warning gave enough confidence to not second doubt anything, and to “pull the trigger”.
The warning came across at 0253Z, providing a 8 minute lead time to the first tornado (past survey analysis performed looking at the Data Assessment Toolkit shows a small EF-1 tornado touched down at 0301Z).
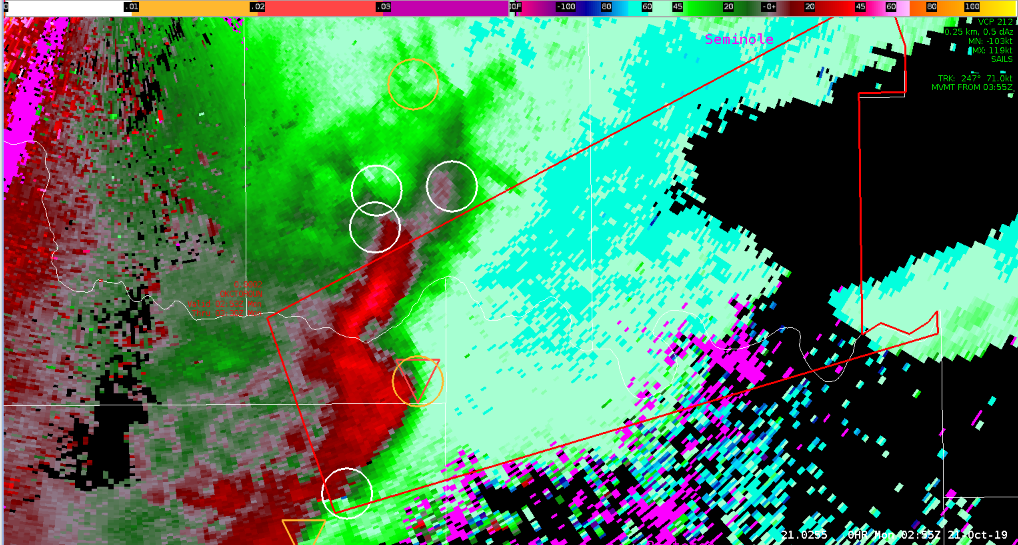
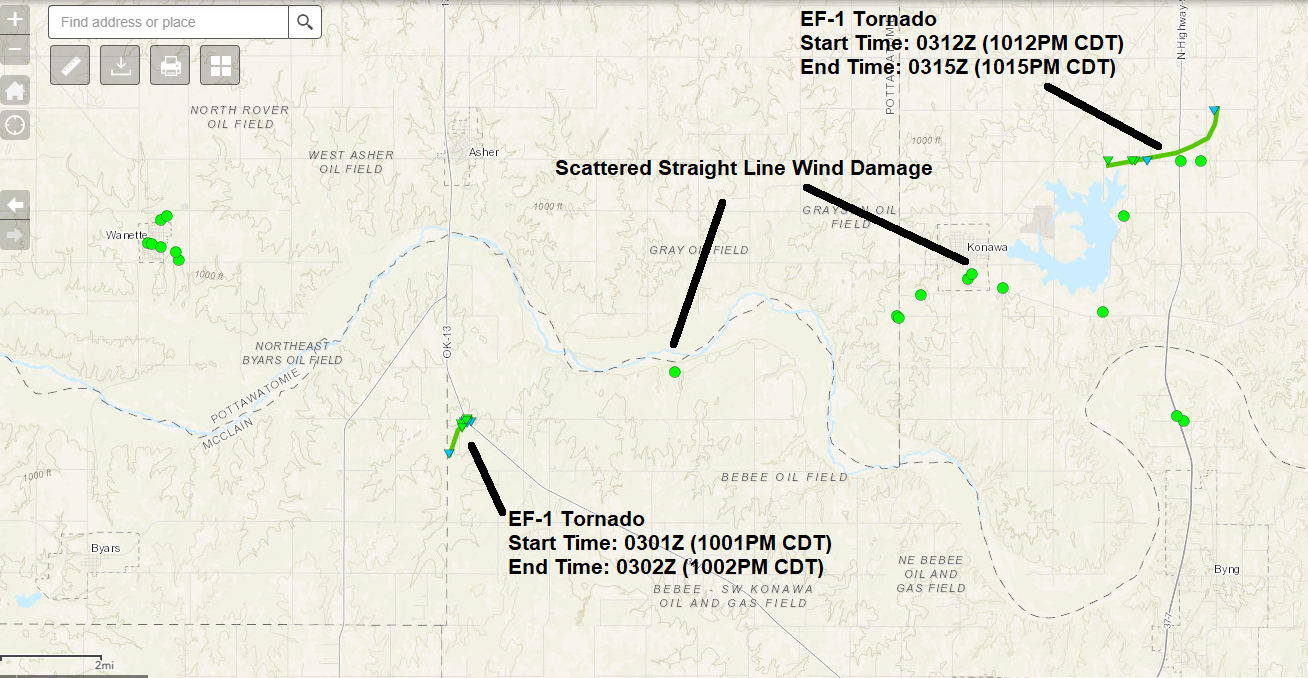
0250Z (0950PM 10/20/19) KTLX 0.5ºSRM plotting NTDA and NMDA.0253Z (0953PM 10/20/19) 10/21/19 KTLX 0.5ºSRM plotting NTDA and NMDA.0255Z (0955PM 10/20/19) KTLX 0.5ºSRM plotting NTDA and NMDA.Tornado tracks and wind damage reports from the Damage Assessment Toolkit (DAT) showing two small tornadoes, and scattered wind damage from the local line surge/area of rotation.
Did the NTDA/NMDA algorithms make my decision? No, and honestly I am not sure when or where it would. What this does show is how these tools provided the confidence needed to make the decision, which in a stressful situation is vital. Confidence is hard to come by when making warning decisions, as there are so many tools (sometimes too many). I would safely say the NTDA/NMDA algorithms provided extra confidence to my warning decision which ultimately led to a positive lead time from my tornado warning. Great tool!
The TSA/OUN case was a mixed bag of supercell structures and QLCS storm types. Overall the performance of both the NMDA and NTDA did well. They showed higher values where you would expect to see stronger rotation. I thought both did particularly well with identifying areas along the QLCS where you would expect tornadic development based on the 3 ingredients method. Most of the detections, especially moderate or strong detections, were in favorable regions.
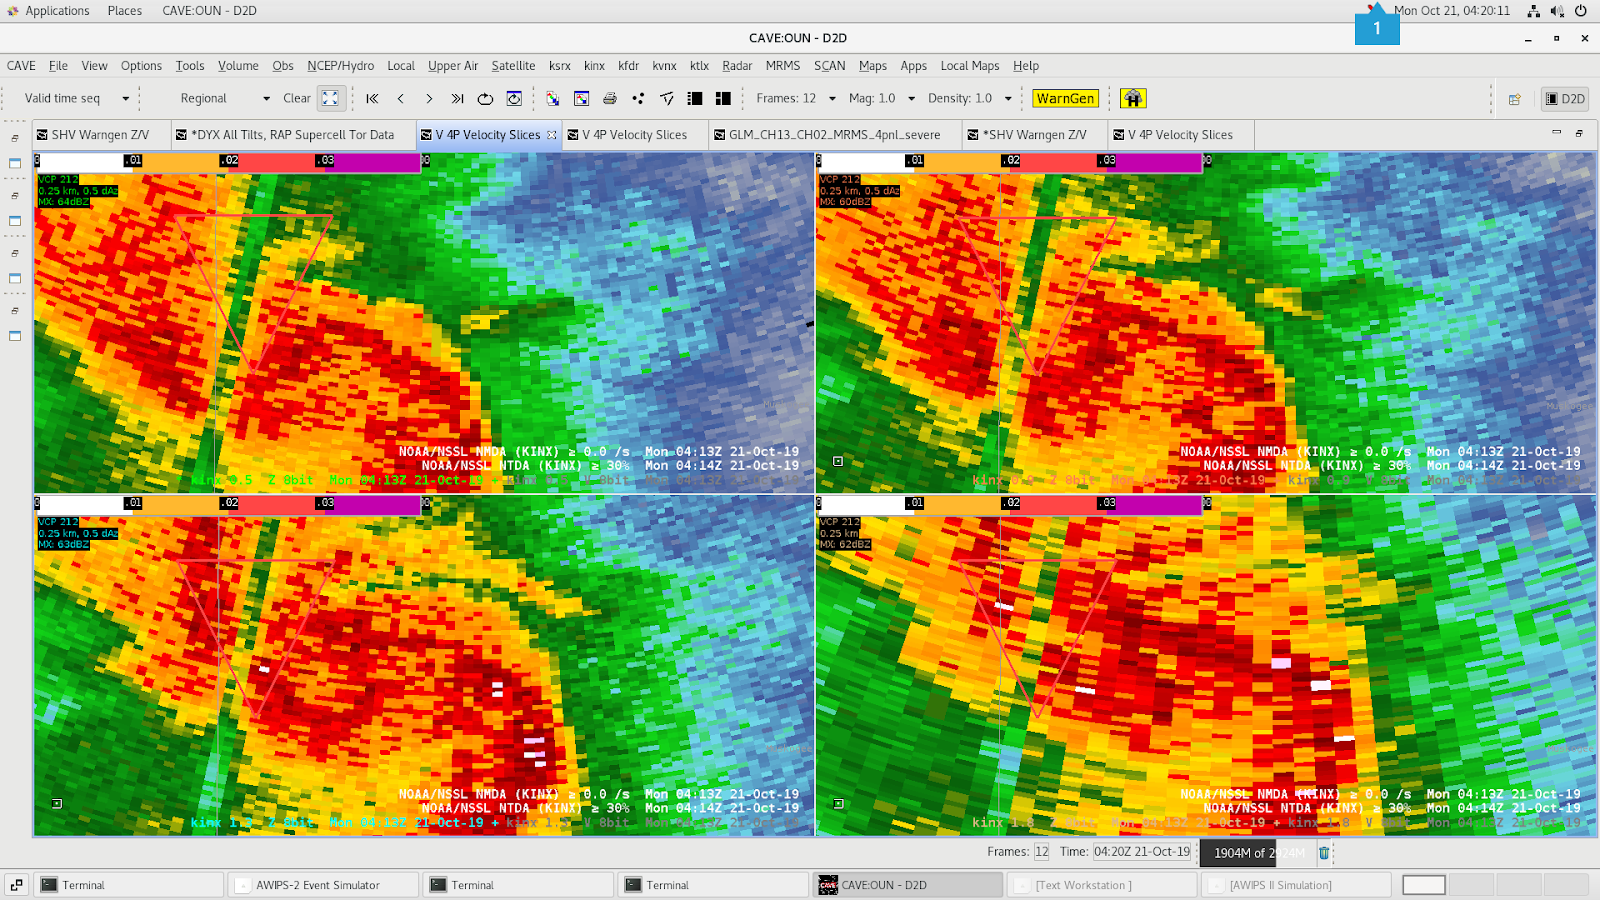
There were two very noticeable issues during the event. The first was caused by a bad radial close to the northern bookend vorticy of the QLCS. The NTDA picked up on the shear near the bad radial and identified it with a higher prob value. But it failed to identify a real couplet slightly further east. This may have been due to the distance requirement between two detections. The NTDA may have filtered out the nearby real detection favoring the artificially higher shear a bit further west. The NMDA didn’t detect either area.
0.5, 0.9, 1.3 and 1.8 Velocity data from KINX. Beam blockage caused an artistically high azShear value. Which may have prevented the NTDA from picking up on a real couplet.0.5, 0.9, 1.3 and 1.8 Reflectivity data from KINX. Beam blockage caused an artistically high azShear value. Which may have prevented the NTDA from picking up on a real couplet.
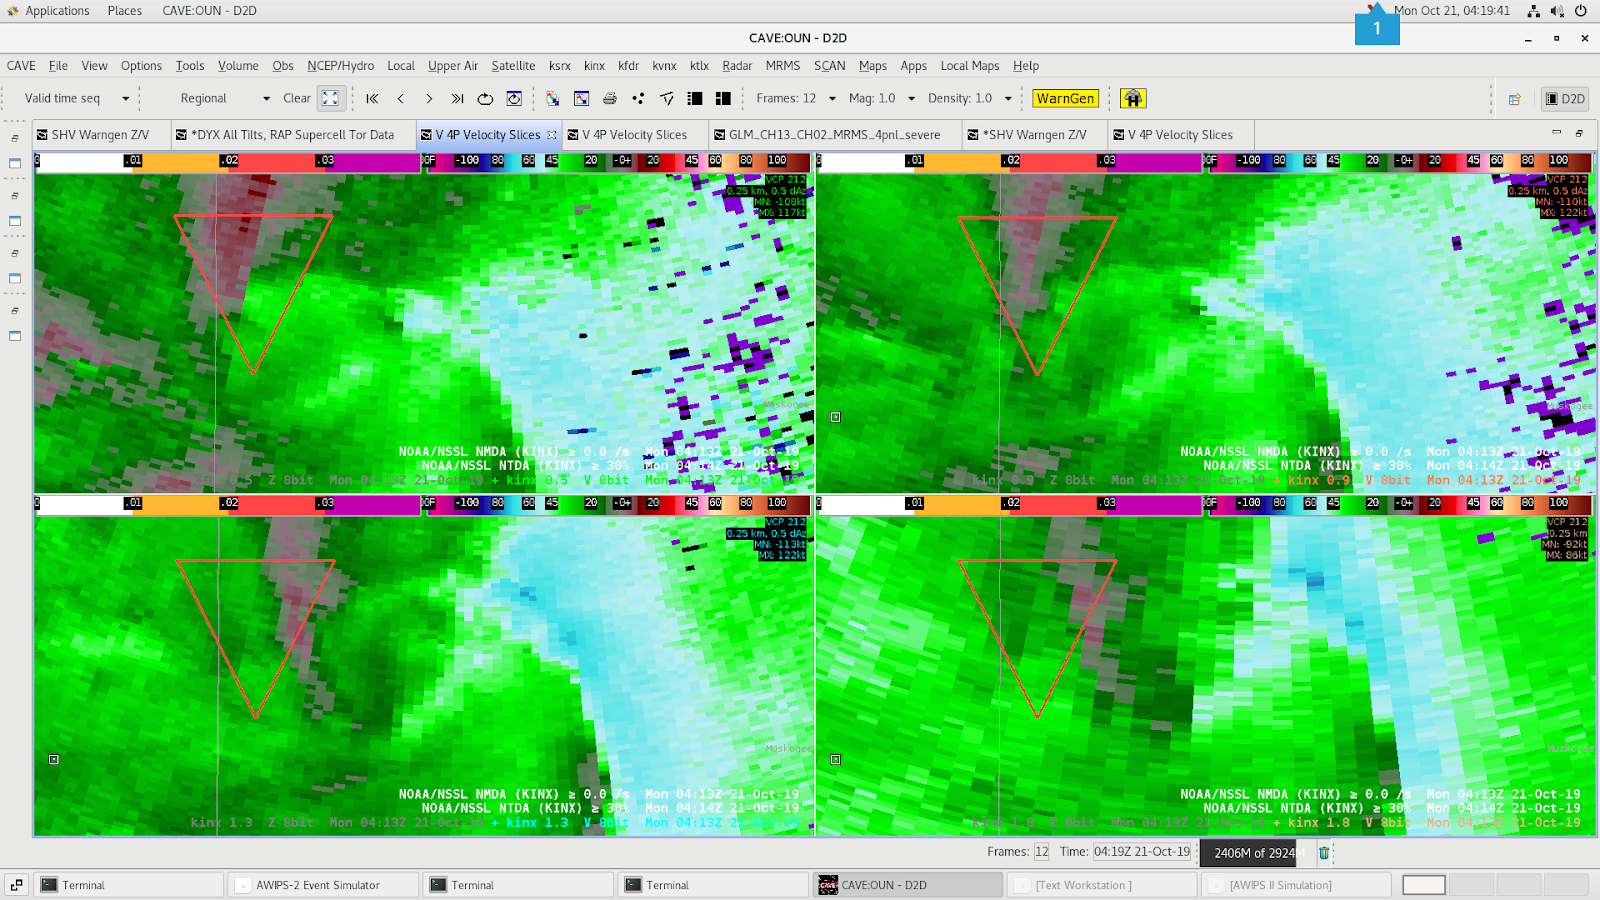
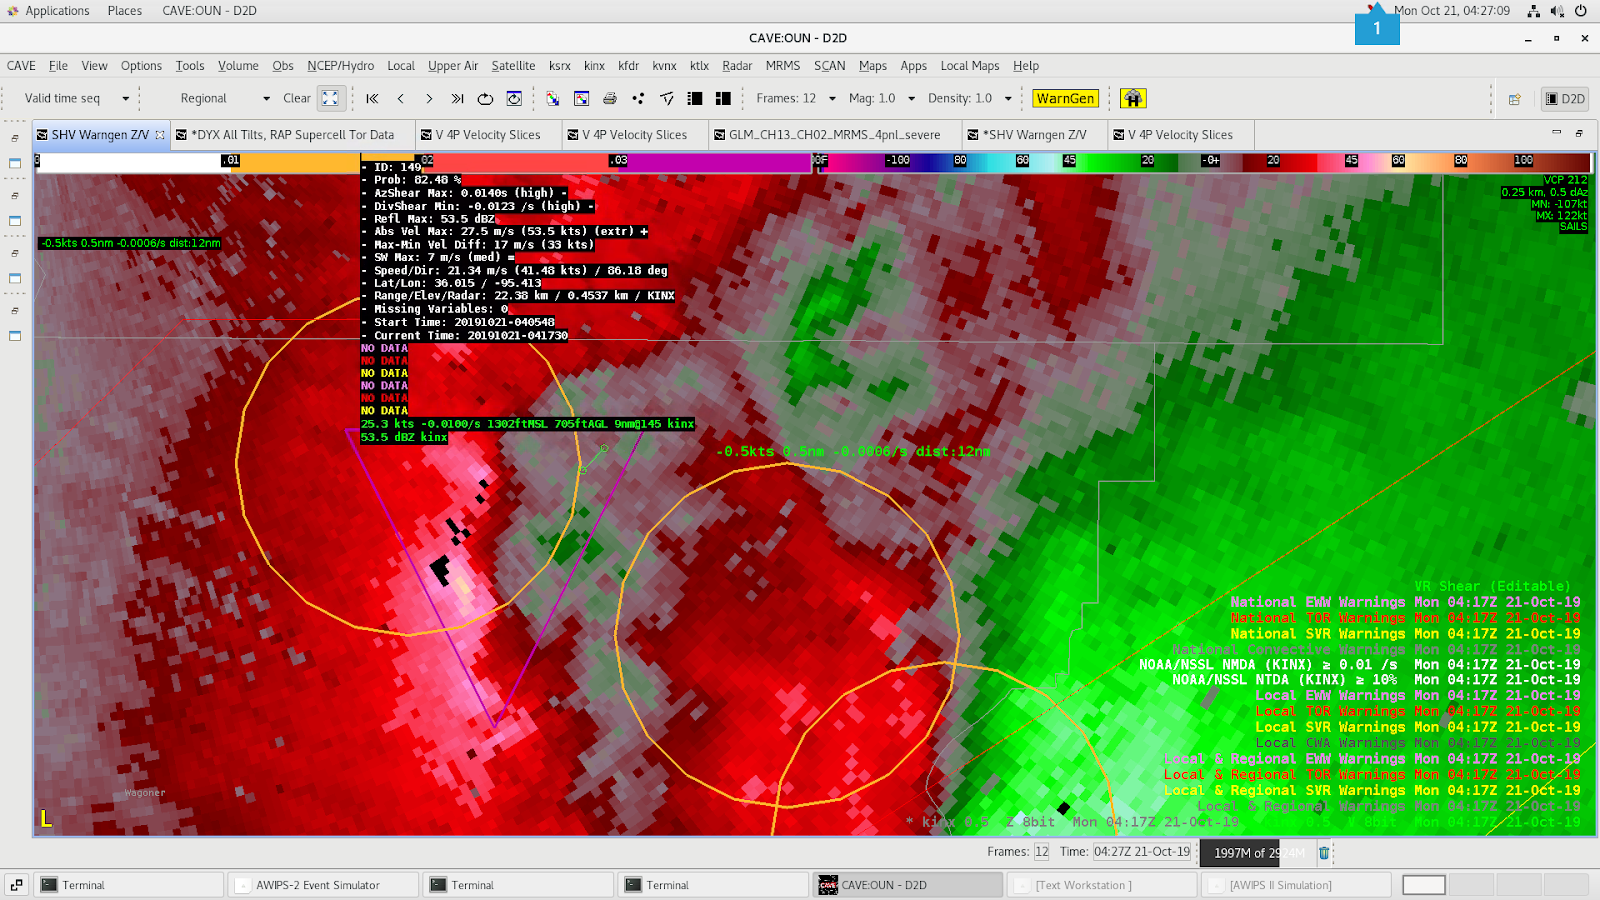
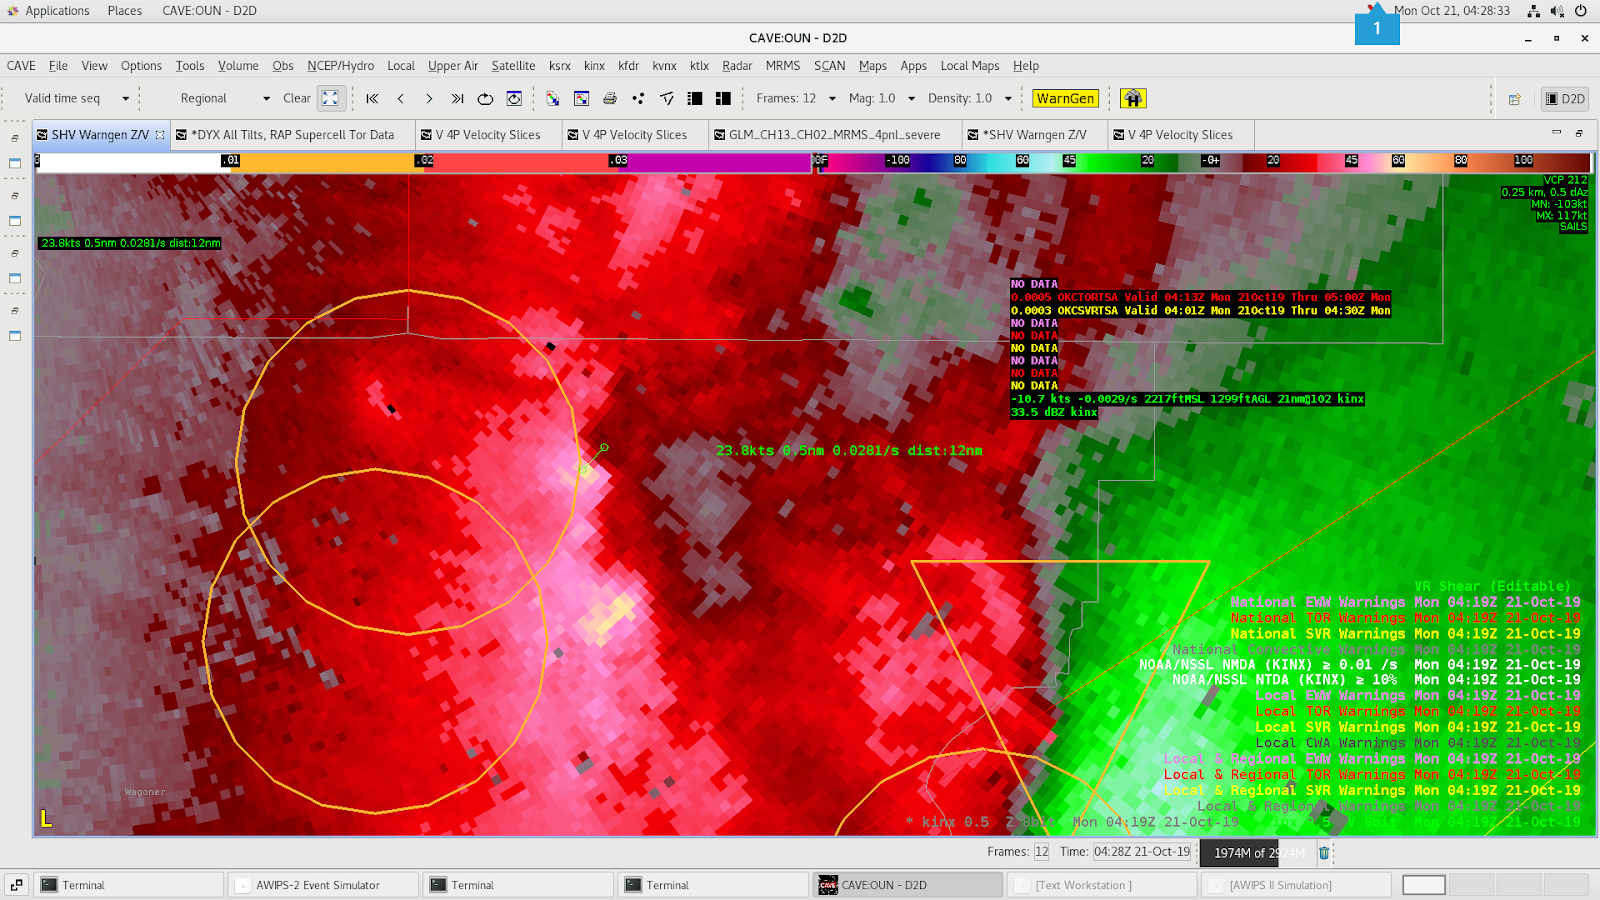
Later on in the event, the NTDA and NMDA detected an area of rotation closer to the KINX radar. The NTDA had a prob of 82% at 04:17Z but then at the next scan (04:19Z) was no longer detecting the circulation, even though it looked tighter than the previous scan. The threshold was set to >= 10% for the NTDA in the image below but I believe even adjusting it to 0% showed no detection. Looking at the velocity data it definitely seemed like there should be some detection on it. The MDA was problematic too. It seemed to detect the two areas of rotation at 04:19Z but they were located well left of the couplet. This could have been because of the known issue with having 3 sails scans in place.
Base velocity data from KINX at 04:17Z. NTDA Prob was at 82.48%.Base velocity data from KINX at 04:19Z. No NTDA detection was made despite a tighter couplet.
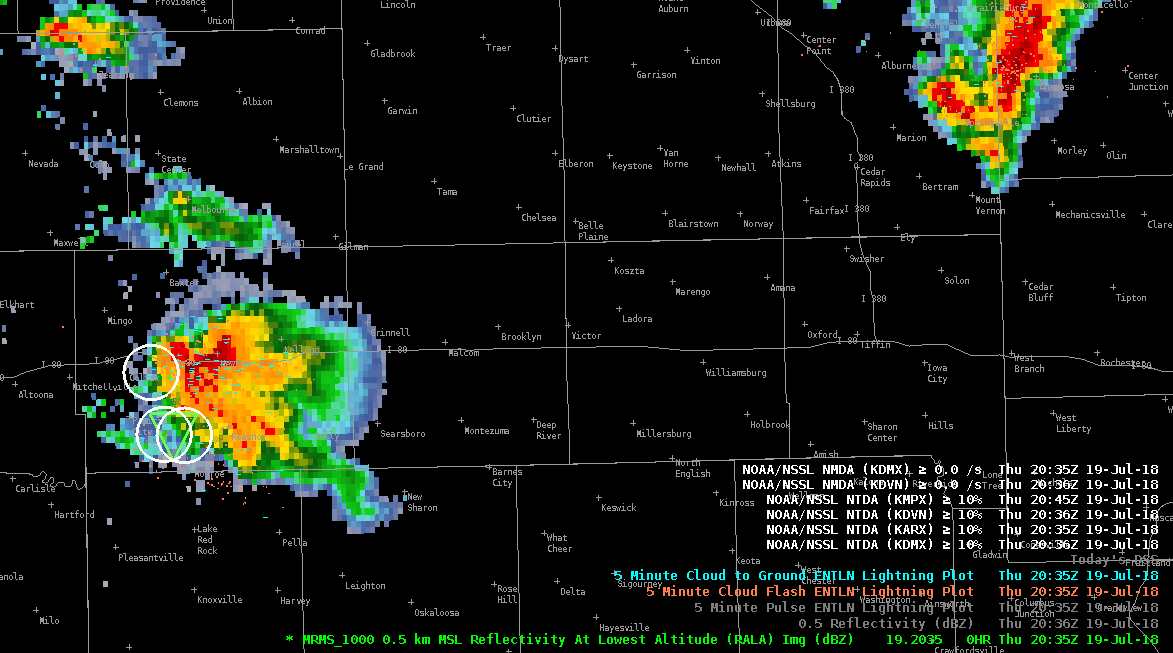
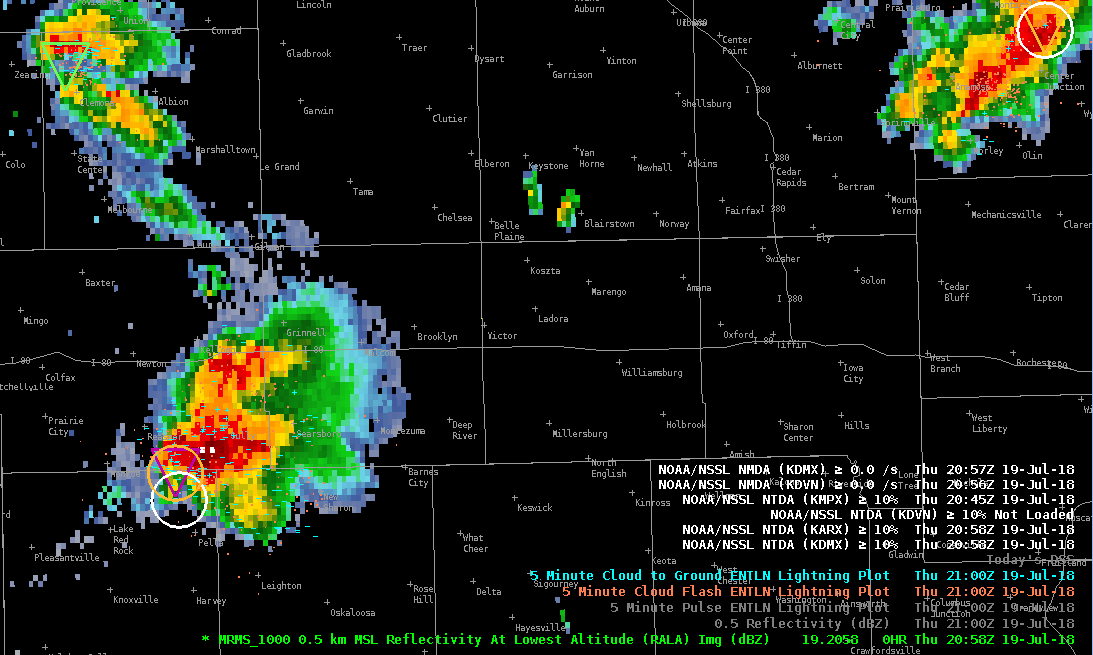
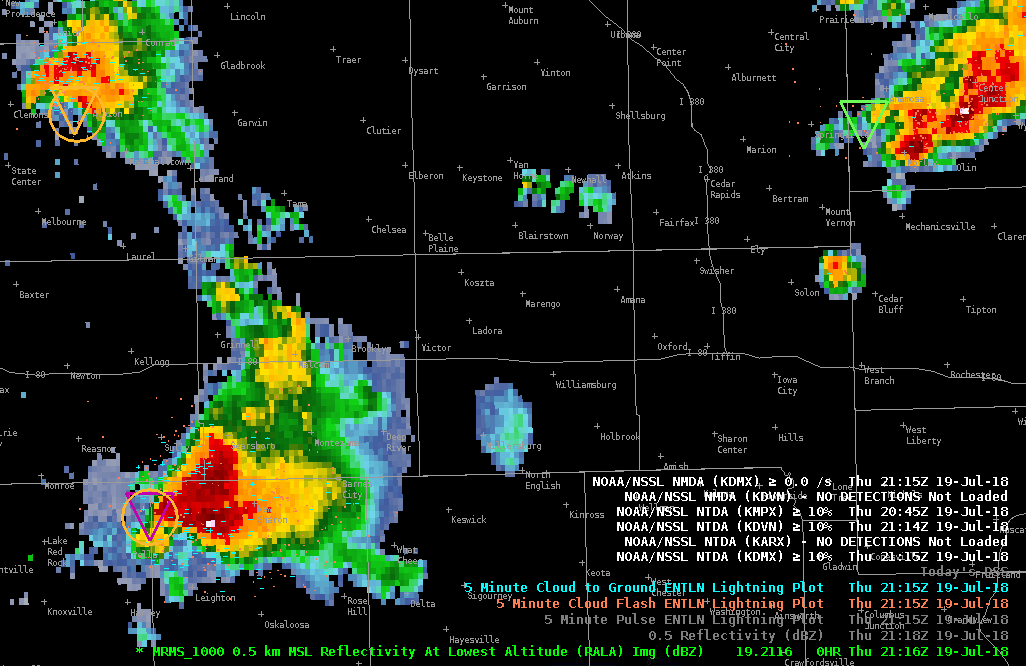
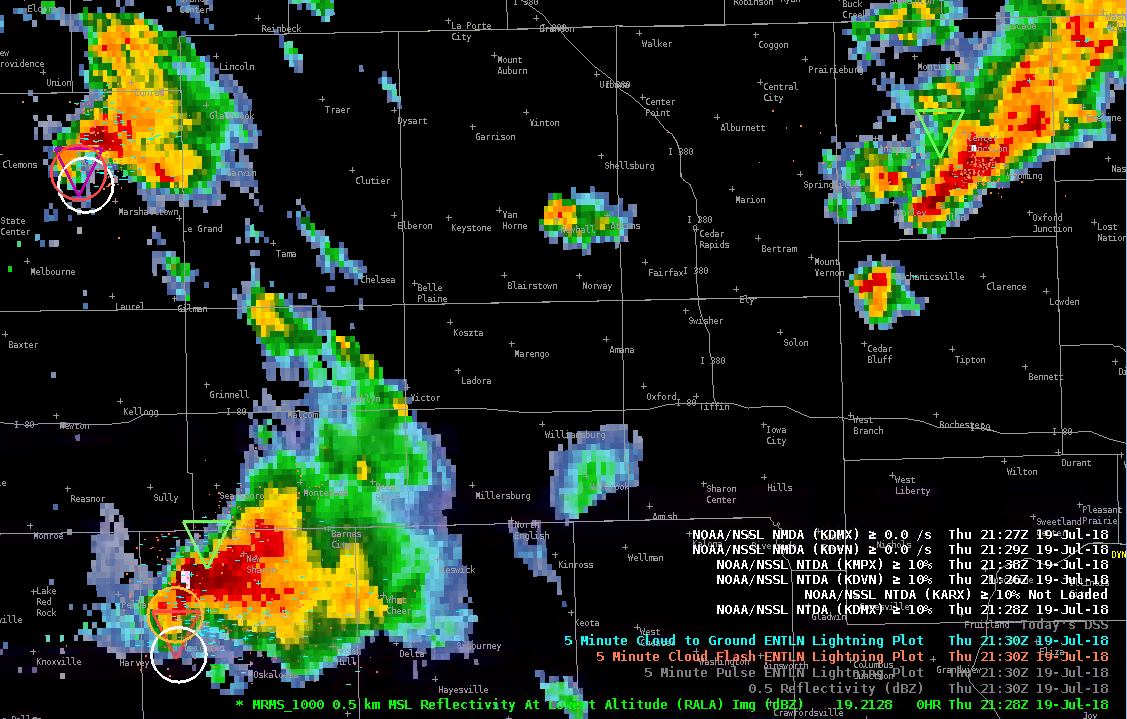
Here’s a series of screenshots showing how both algorithms increased detections and intensity as the event evolved.
DMX 2035ZDMX 2058ZDMX 2116ZDMX 2128Z
After a difficult start to this event in which both algorithms had an absence of detections despite multiple reports of tornadoes and funnel clouds (likely due to very limited Z in the area of weak rotational couplets), both algorithms performed much later in the event when two dominant supercells emerged as the primary threats. Both algorithms showed an increase in intensity coincident with increasing rotational velocity, and for the most part, tracked these features well.
It’s good to see these algorithms do well in relatively obvious situations, because if they can’t get these right, it’d be hard to use these operationally with much confidence.
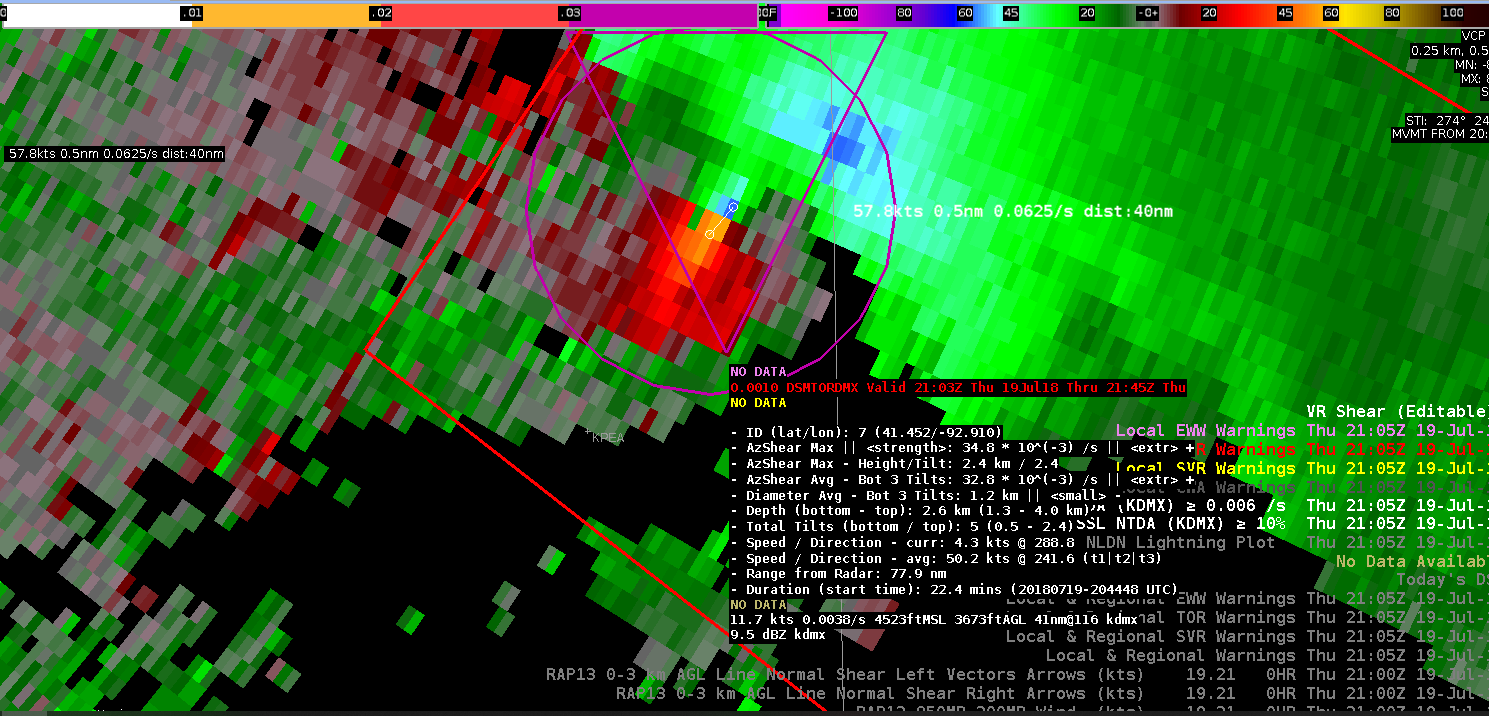
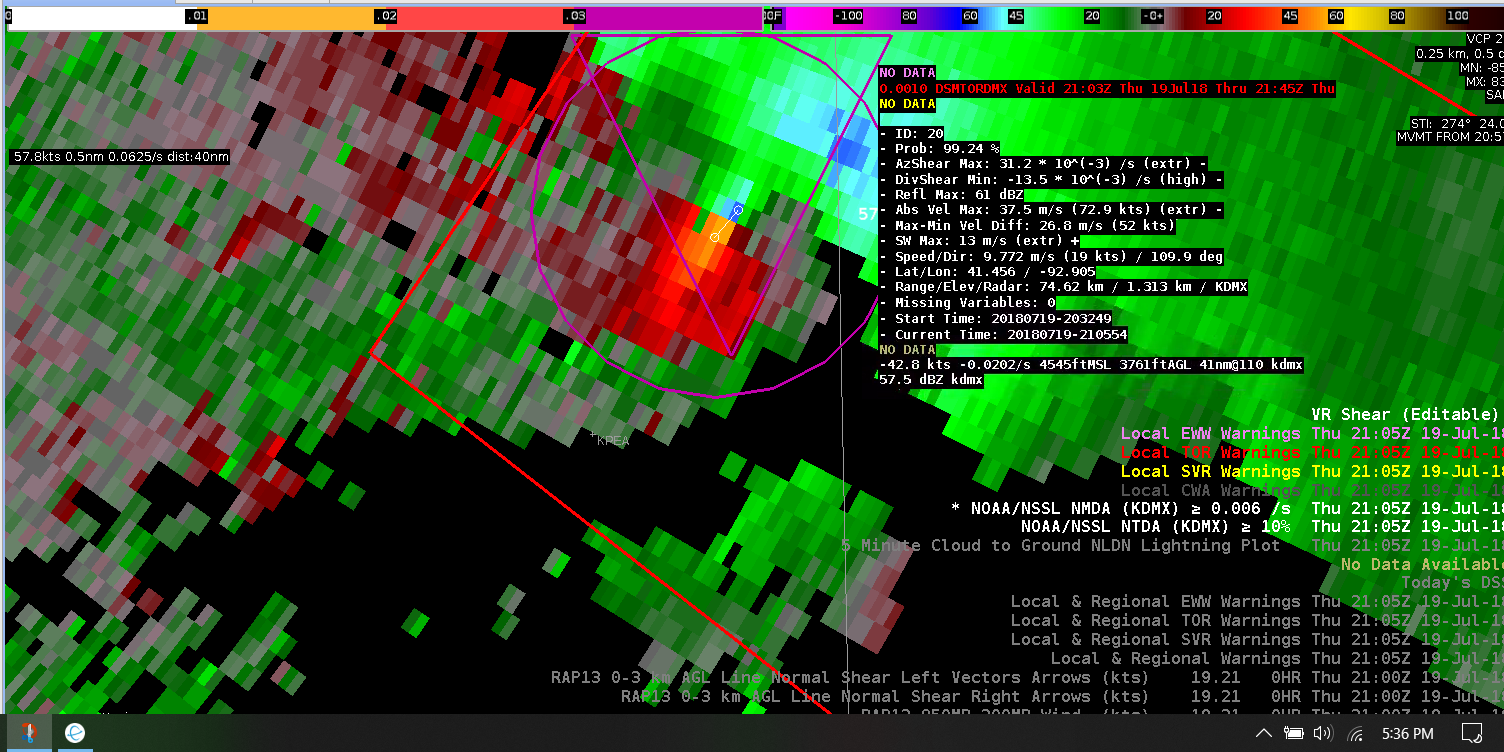
An outlier severe weather event turned out a few classic supercells with tornadoes. The algorithms performed well with this supercell with extreme values on the NMDA, and the NTDA having a 99+ percent chance for a tornado. The V-R shear couplet was intense with a high probability of an intense tornado. Would not be surprised if this was an EF2 or even an EF-3. High confidence tornado warning issued with these algorithms doing a stellar job with a tricky convective environment.
18 July 2019 KDMX 0.5 SRM with NMDA and NTDA overlaid. Impressive tornadic supercell with V-R Shear showing 58 knots of rotation with a shear value of 0.0625 s-1. It was a distance of 40 nm from the radar with an extreme MESO from the NMDA.18 July 2019 2105 UTC KDMX 0.5 SRM with NMDA and NTDA overlaid. Impressive tornadic supercell with a 99+% probability of a tornado and an absolute velocity max of 72 kts!
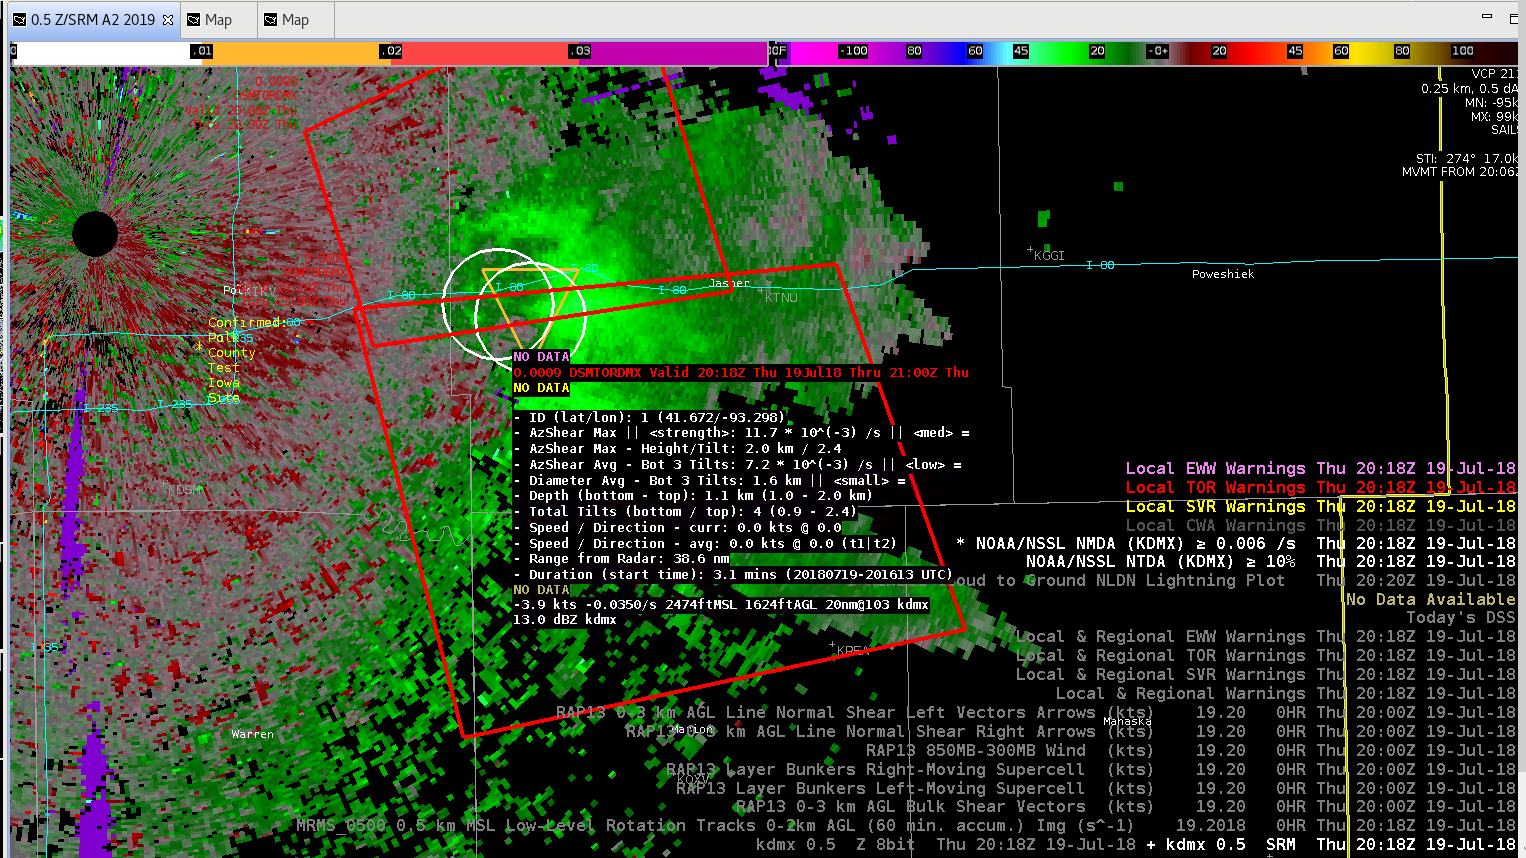
An outlier severe weather and tornado case to say the list. Adjusted NMDA threshold to the bottom value of 0.06 to detect weak MESO’s and the NTDA percentage to 10%. The tornadoes to the east to the RDA I warned on based on the ground truth to the north and what they may have seen outside the WFO DMX. Tornado Probs 10-20% were yielding the tornadoes with very strong inbound velocities. The inflow ahead and along the warm front was strong. The image below is the 2018 UTC 0.5 DEG SRM with NTDA and NMDA algorithms overlayed. Also, the TOR polygons I issued were overlayed. Slider Bars and ground truth was the key to this event.
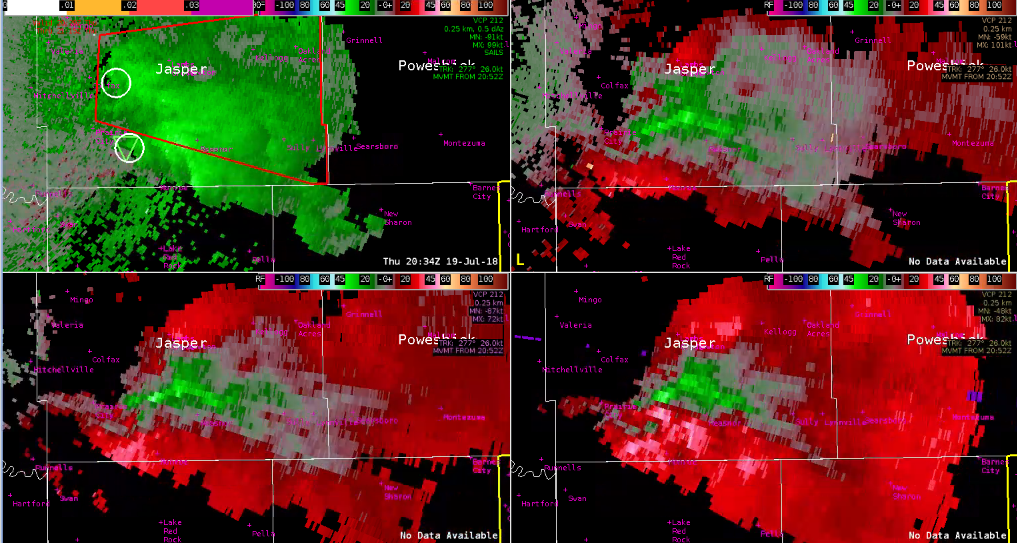
Here’s a quick, classic example of where meteorological situational awareness plays a large role in storm interrogation while using the NTDA/NMDA algorithms. A first look at Base Reflectivity shows higher probabilities of NTDA/NMDA at a position of the supercell well detached from where you would commonly expect strong, deep rotation (notice the BWER also in the top left, cool!).
2157Z 7/19/18 KDMX. Top Left: 0.5º BR. Top Right: 3.1º BR. Bottom Left: BR 4.0º. Bottom Right: BR 5.1º.2157Z 7/19/18 KDMX. Top Left: 0.5º SRM (Storm motion 280º at 18kt). Top Right: 3.1º SRM. Bottom Left: SRM 4.0º. Bottom Right: SRM 5.1º.
Sure enough, looking at SRM confirms messy and anomalous values of SRM likely associated with the back end of a boundary or front. Another example of anomalous values from both algorithms and how situational awareness can avoid miss identifying aspects of a supercell.
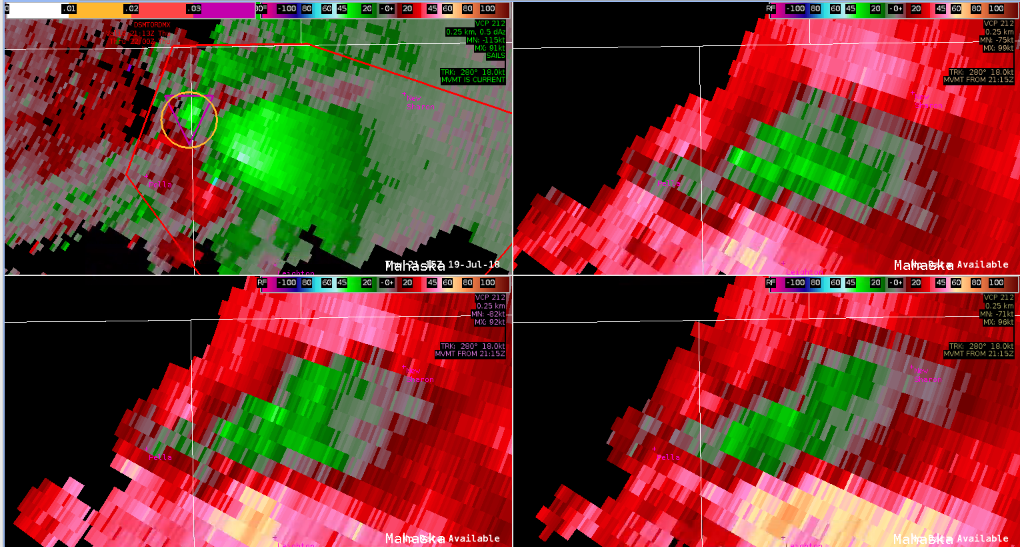
Interesting confirmation from the NTDA/NMDA Algorithms in the DMX Archived Review. An earlier Tornado Warning was in effect for a main ESE tracking supercell, with plenty of storm reports previously. Out ahead of this storm, a weak cell was approaching from the SW and was beginning to merge and cut off the necessary inflow to the already ongoing tornado in south-central Jasper County.
This brought forth an interesting situation. NMDA/NTDA algorithms were lining up but at low probabilities at 2034Z (NTDA 23.56%) which was enough to grab my attention. Since this entire event was tricky due to such an elevated storm environment (analyzing SRM/BV at atleast 3.1º and above), seeing the algorithms line up was enough confidence given to propose a new TOR for the southern part of the current polygon.
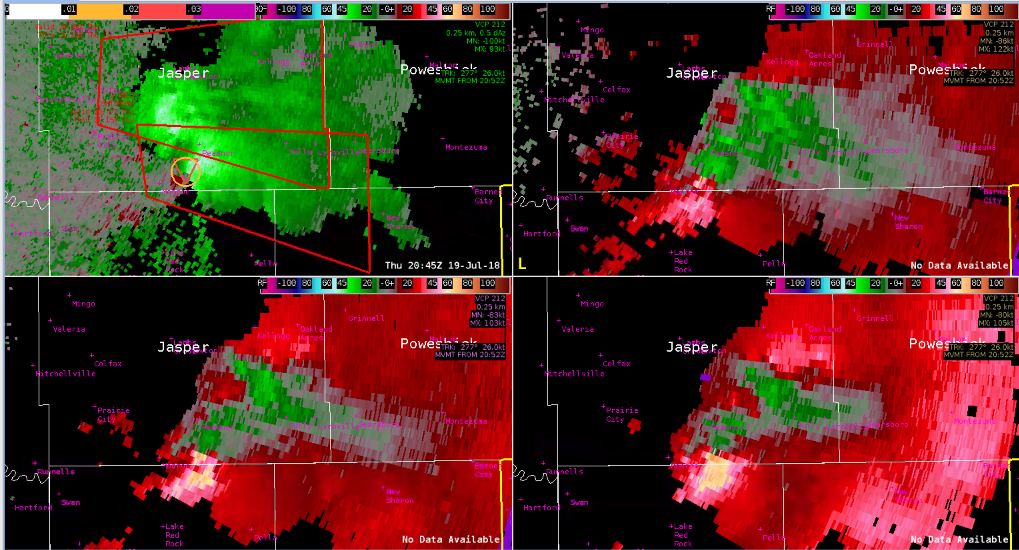
2034Z 7/19/18 KDMX. Top Left: 0.5º SRM (Storm motion 277º at 26kt). Top Right: 3.1º SRM. Bottom Left: SRM 4.0º. Bottom Right: SRM 5.1º.
From here, NMDA began to show increasing trends which supported a visual interpretation of increasing cyclonic rotation in the mid levels.
2041Z 7/19/18 KDMX. Top Left: 0.5º SRM (Storm motion 277º at 26kt). Top Right: 3.1º SRM. Bottom Left: SRM 4.0º. Bottom Right: SRM 5.1º.
Further increases in NTDA/NMDA along with increasing Vrot now in the lowest tilt (indicative of either a strengthening tornado or stretching/tightening of rotational velocity to the lowest levels) increased forecaster confidence in the decision of a warning.
2045Z 7/19/18 KDMX. Top Left: 0.5º SRM (Storm motion 277º at 26kt). Top Right: 3.1º SRM. Bottom Left: SRM 4.0º. Bottom Right: SRM 5.1º.
This was a great illustration of both an early heads up, and a warning confirmation from both algorithms. Only mistake was not using the Bunkers Right Motion wind barbs to illustrate a tall enough updraft’s potential at a far right deviant motion (with a follow up warning clocked much more southeast to account for this motion)