Severe wind across SC with isolated tornado/hail

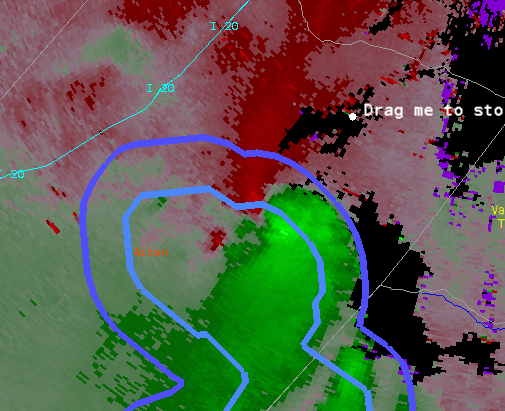
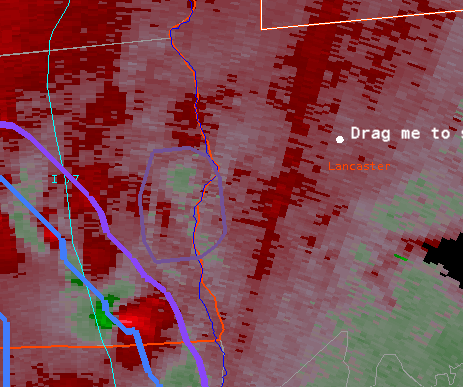
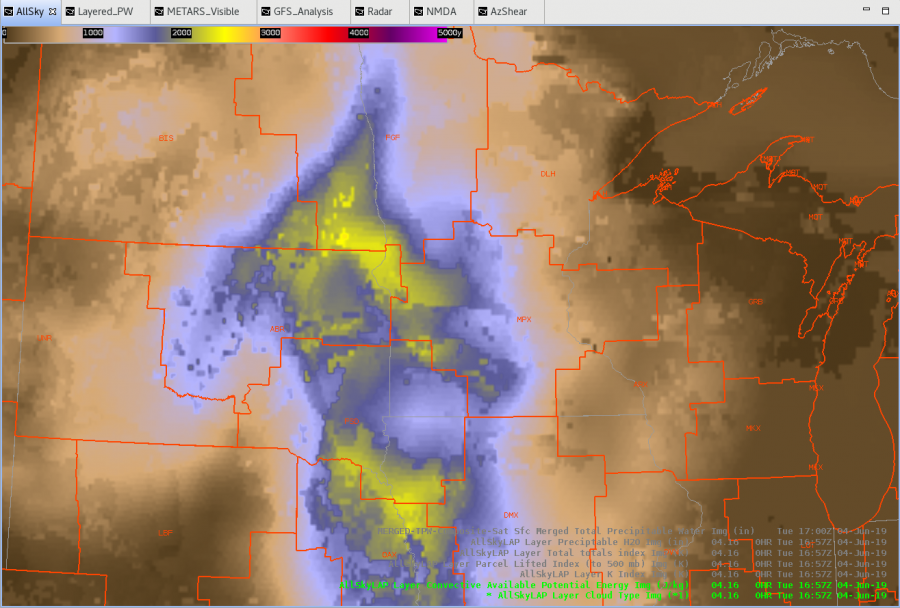
This was the lone tornado warning I issued. It was borderline but a nice MCV wrapped up after this. Likely contributed to some severe winds at times.

This helped lead to a warning at 2146 UTC. This cell was near our southern CWA border. This looked good for hail.

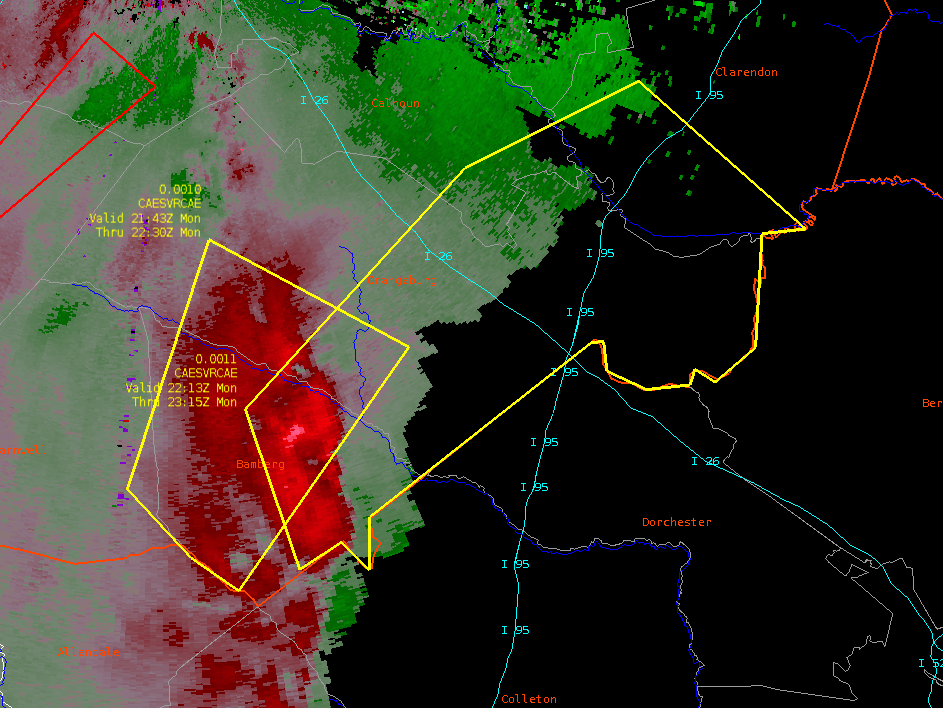
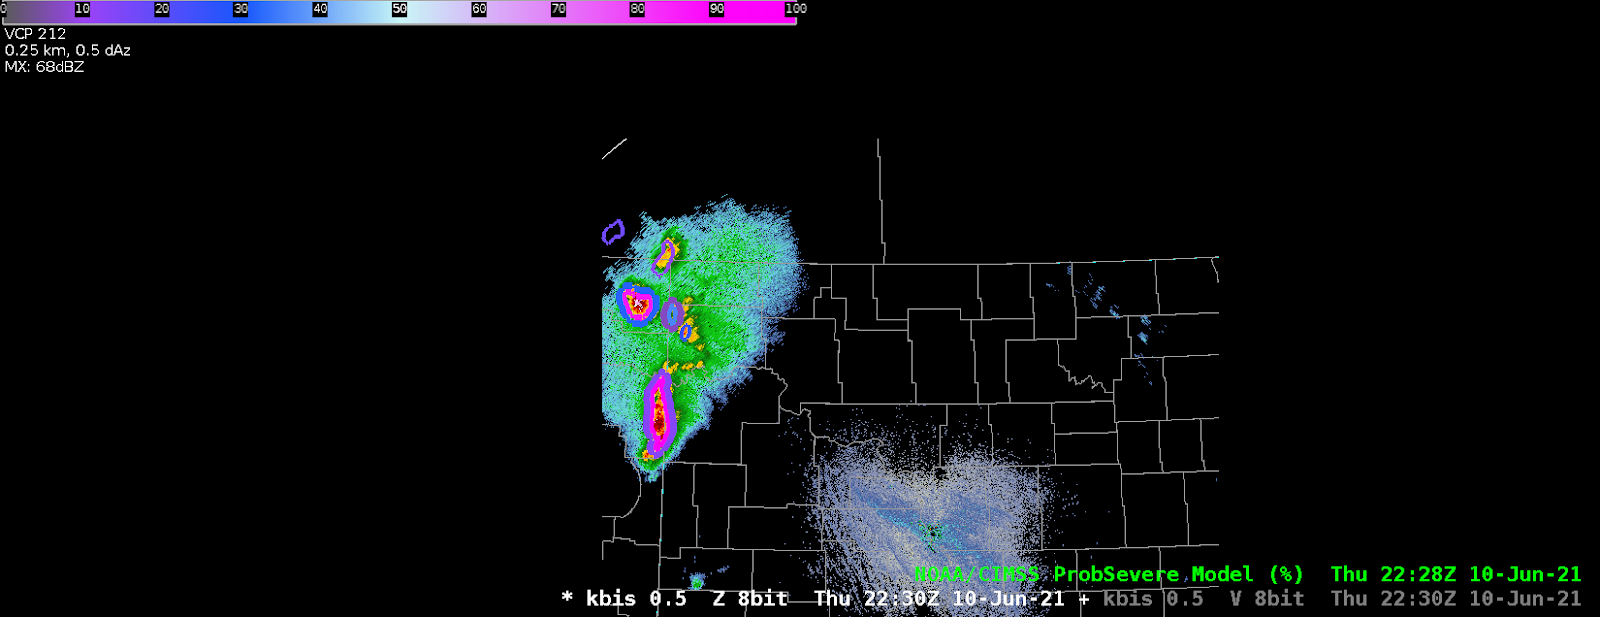
Here is the same storm a bit later when it’s more of a wind threat. 40 kt winds showing up even with a poor radar angle.

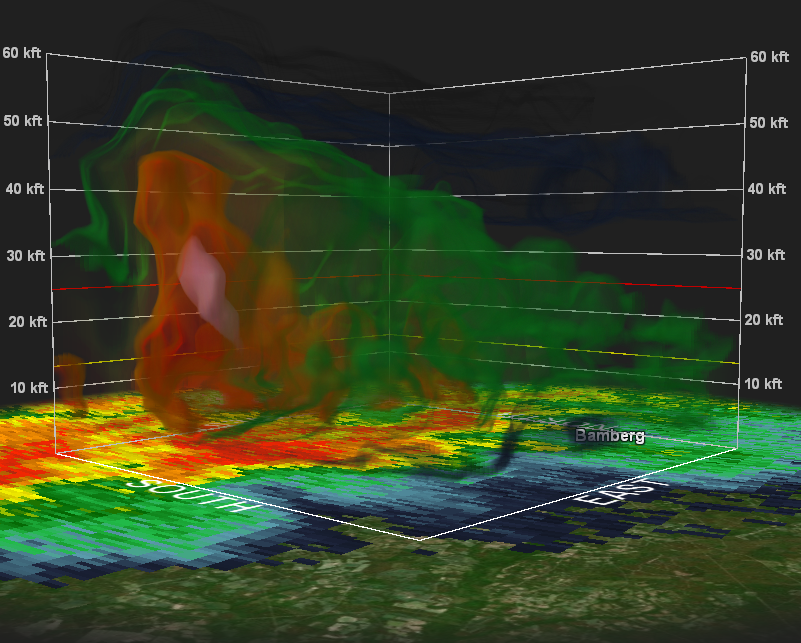
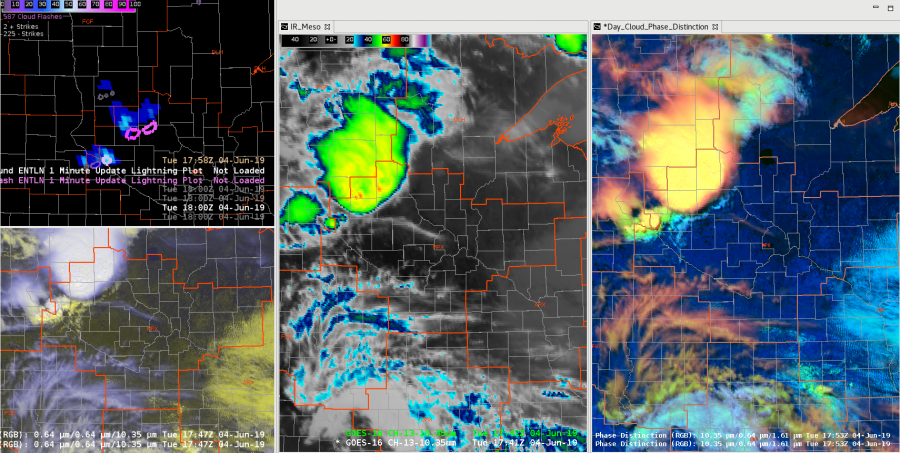
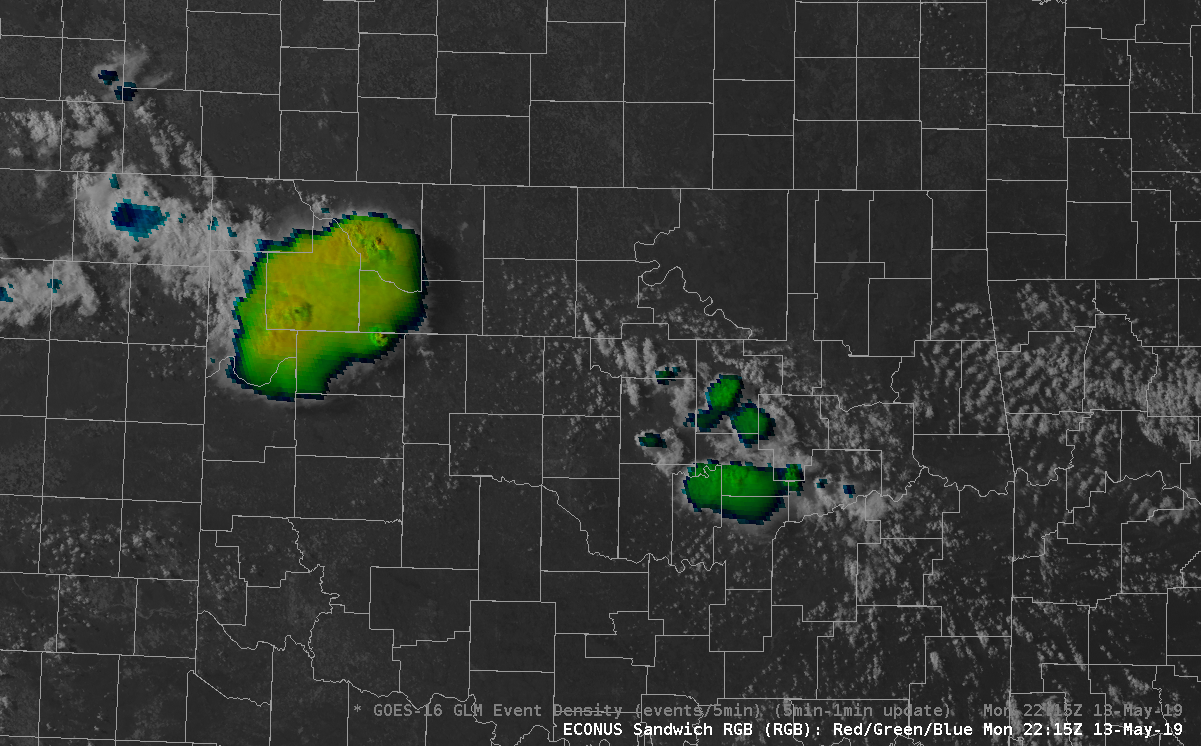
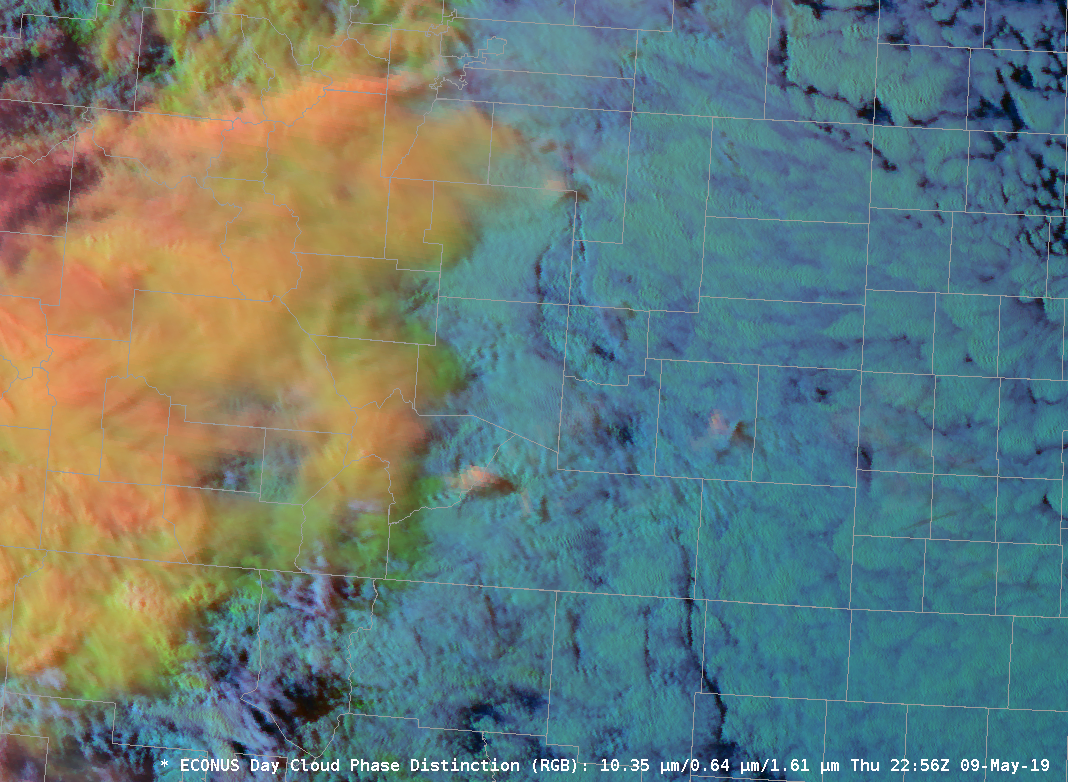
Good overshooting top with that same storm showing up nicely in the DCP.

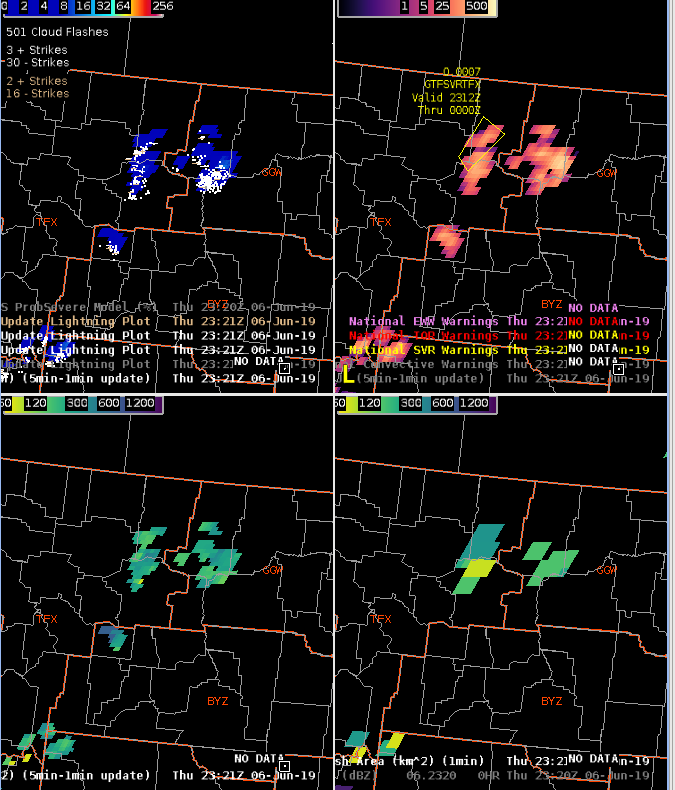
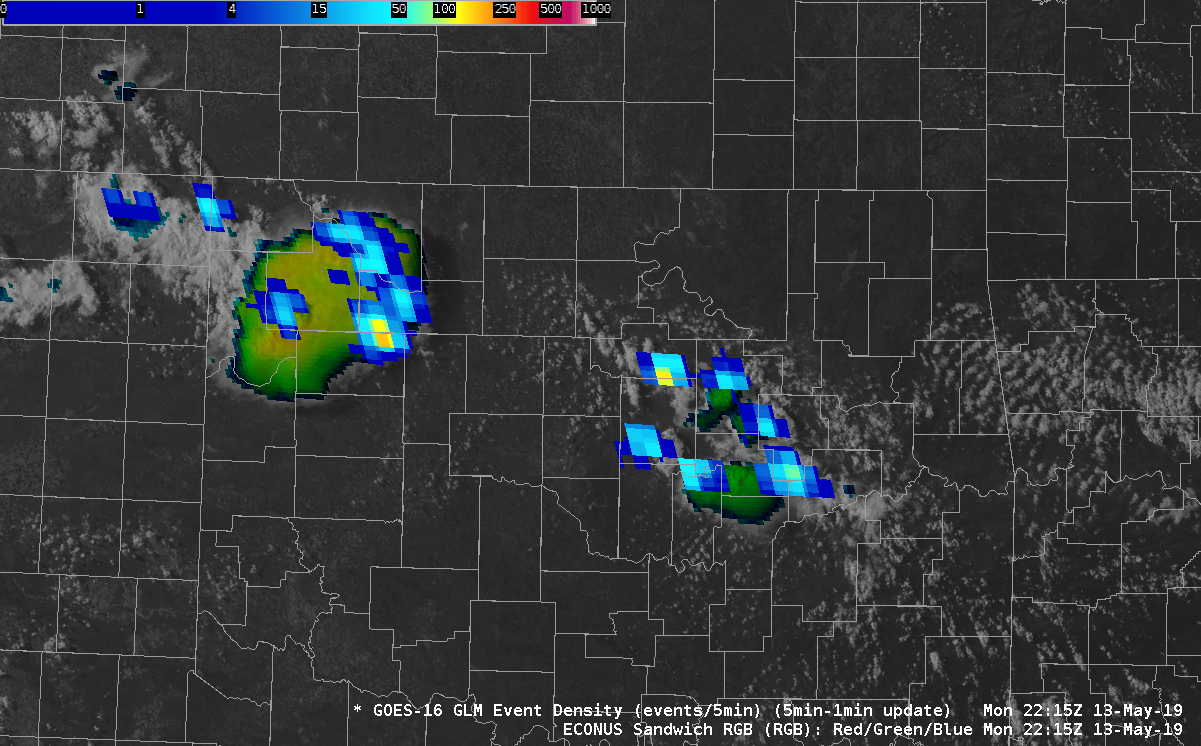
Other notes. I liked the idea of the micro wind product but it’s too hard to read. Needs work to be usable.

One last minute tornado warning…

  • Some Random Guy

Use of Cloud Phase Distinction RGB to anticipate convective initiation over Western Dakotas and Eastern Montana

Some members of the 12z Thu Jun 10 HREF run were a bit slow in initiating convection or too far east in developing convection over the Northern Plains. The NSSL WRF-ARW was closest to reality with respect to exact timing and location. A special 18Z RAOB from Glasgow (GGW) MT and the Cloud Phase Distinction RGB proved to be very helpful in showing convection was going to develop earlier than anticipated by the HREF guidance. The 18Z RAOB from GGW (below) showed weak CINH values, while the Day Cloud Phase Distinction RGB (second graphic) showed an agitated cumulus field that was becoming quickly glaciated (single cell with yellow cloud top near the 93/61F sfc obs) indicating deep convective development was imminent.

Once deep convection initiated, single channel ‘Clean IR’ imagery and Day Convection RGB became more useful in determining updraft strength. These two products can be extremely useful in severe weather detection and warning decision making especially in absence of radar and/or lightning data or when used combined due to its faster temporal coverage (1-min in meso sector vs 5-min from radar).

The image above shows updrafts getting stronger in the 10.3 micron imagery (bottom left), and on the Daytime Convection RGB (bottom right) by evidence of yellow (red +green) pixels. Inflow feeder bands, a flanking line, towering cumulus above an invigorating RFD or flanking towers, and above anvil cirrus plume are also observed in the Day Cloud Convection and Cloud Phase Distinction RGBs (top panels) indicative of the storms likely being severe. In fact, the ProbSevere v3 and v2 output both indicated a very high probability of severe weather occurring with these storms with values over 90% (purple colors).

Tall cell in western GGW’s area

Strong updraft in western GGW showed the red colors going over to greens…likely the updraft getting into the warmer stratosphere.

Day cloud phase distinction loop over the area shows a continued strong updraft with gravity waves radiating outward.

Quite a bit of flashes in that cell in GGW.

Charley

Severe Threat over Minnesota This Afternoon

Ongoing complex of thunderstorms pushing into south central MN this hour.  Have a new set of thunderstorms forming in what AllSky is showing as a higher CAPE environment along the outflow pushing out from this complex.  ProbSevere has picked up on this cell as well (near Milan)…showing a Hail chance of 55% now and growing quickly.  Will monitor the downstream growth of both systems.

VisIR Sandwich of MCS

VisIR sandwich product has been a very useful way to combine the high res visible imagery with the cloud top temperatures. However late in the day as the sun angle gets lower, the image gets darker. One way to remedy this is to adjust the composite options (right click on legend), and equally lowering the Gamma setting. This will brighten up the image and allow better utility into the low sun angle hours before sunset.

Default:

After:

How to adjust settings:


— warmbias —

Event Density with RGB Composite VIS/IR Sandwich

Image 1 shows the  GOES16 RGB Composite VIS/IR Sandwich.  This product displays the texture of the convective cloud tops and the temperature of those cloud tops.  The texture and temperature of the clouds provides information about the updraft.  The 2nd image shows the most intense GOESR GLM event densities and how they correspond with the taller clouds and strong updrafts. – Jonathan W. Smith (ESSIC/UMD) .

GOES 16 – Full Disclosure

Ok, last post….honesty time.

I didn’t make this a secret in my application that I had been out of meteorology for about 4 years between 2014-2018. During that time, GOES-16 launched. As I returned to broadcasting, I didn’t adequately spin-up on the new capabilities of this new generation of satellites. I was aware of the spatial and temporal resolution improvements of course – what meteorologist – currently working in or out of the field, didn’t get excited about 1 minute imagery?

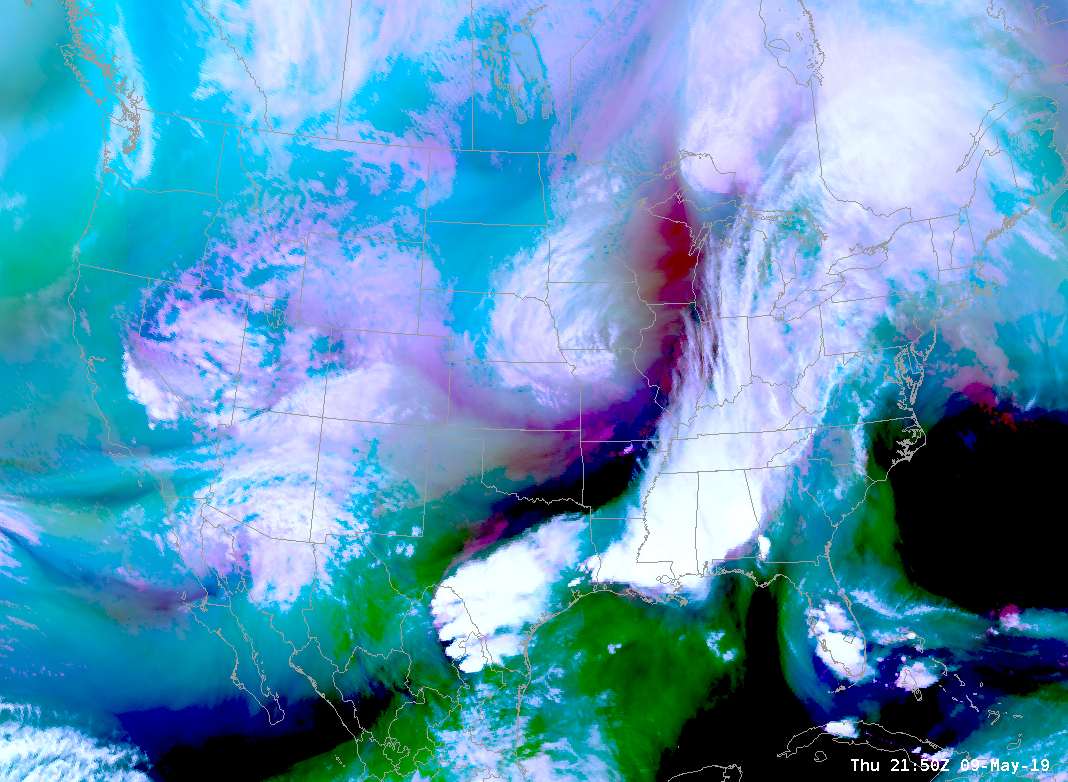
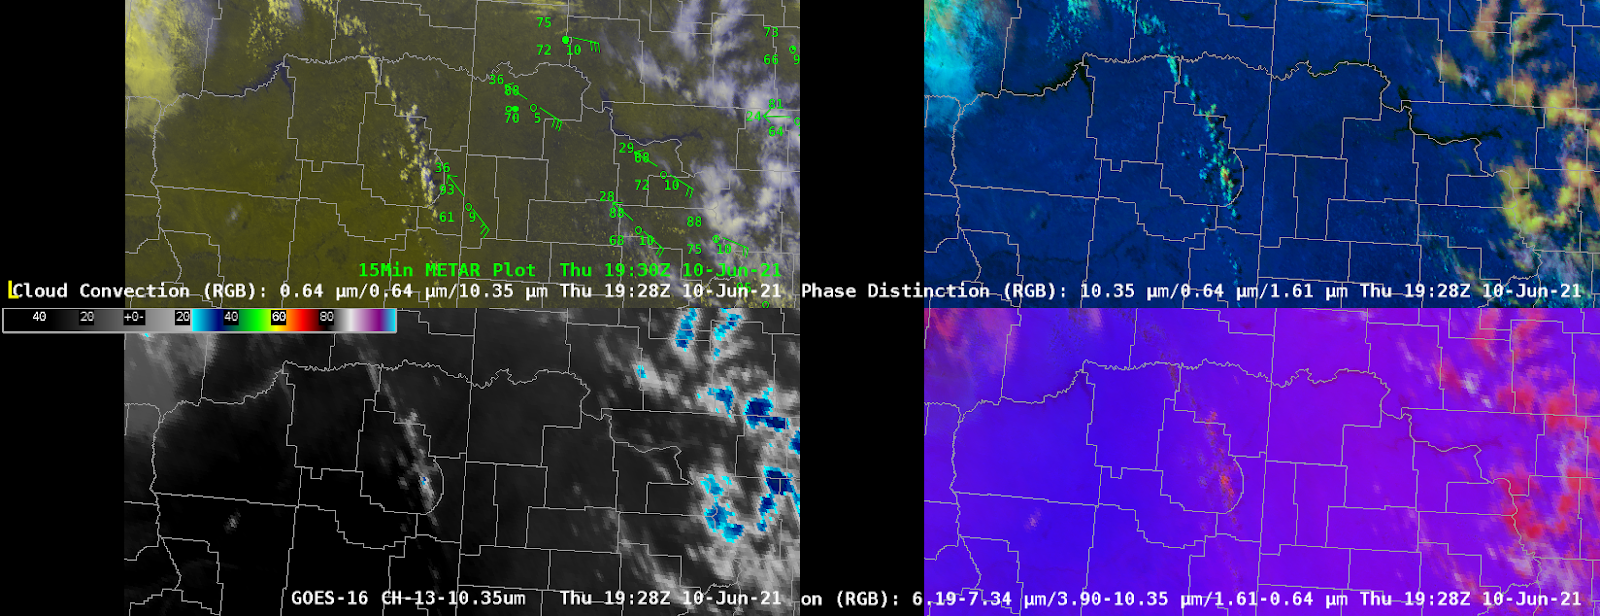
However, I wasn’t aware of some of the RGB combinations that I’ve been exposed to here at the HWT. The features that can be picked out by applying coordinating colortables to multiple channel views is simply astounding. I’ve used the simple water vapor, day cloud phase distinction, day convection, differential water vapor RGBs this week….I’ll be making a phone call to my broadcast weather vendor. I know I’ll need to get some other broadcasters on board with me to lead a charge, but count me in. Until then, I’ll be livin on the CIRA RMMB Slider site!

Color (RGB) Me A Fan!

-icafunnel

This was interesting

Since things were kinda boring over HGX today I had to look for things to blog about. Here is something interesting that I noticed with the Vis/IR Sandwich RGB. At the beginning of the loop the RGB didn’t show any IR brightness temperatures. As the TCU continued to develop we saw pixels of IR brightness temperatures starting to show up indicating cold cloud tops and the potential for glaciation to start. Low and behold, if we continue to watch the loop, more pixels start showing up…and a few minutes later both GLM and ground based networks picked up on a couple of CGs. As the thunderstorm developed, cloud tops cooled and more pixels started getting displayed we began to see more lightning.  This was something that I didn’t expect the RGB to pick up on and potentially helpful for situational awareness and IDSS in the west where most lightning tends to come from single cell thunderstorms. If you are able to pick up on these ahead of time you may be able to some lead time before lightning occurs.

Update…it happened again, pixels starting being displayed and then lightning occurred within a couple of minutes. If this generally hold true for single cell thunderstorms this would be awesome for outdoor IDSS.

Spectacular 1 min GOES satellite imagery of a Colorado supercell

Using feature following zoom to stationary view track a supercell  in ECO. Many things visible here, including uplift and twisting of stratus deck in the inflow region, anvil plume texture, and updraft texture. The parallax error ends up helping the user get more info about the vertical structure and composition of the storm – contrary to the often requested need for ‘parallax corrected’ imagery.

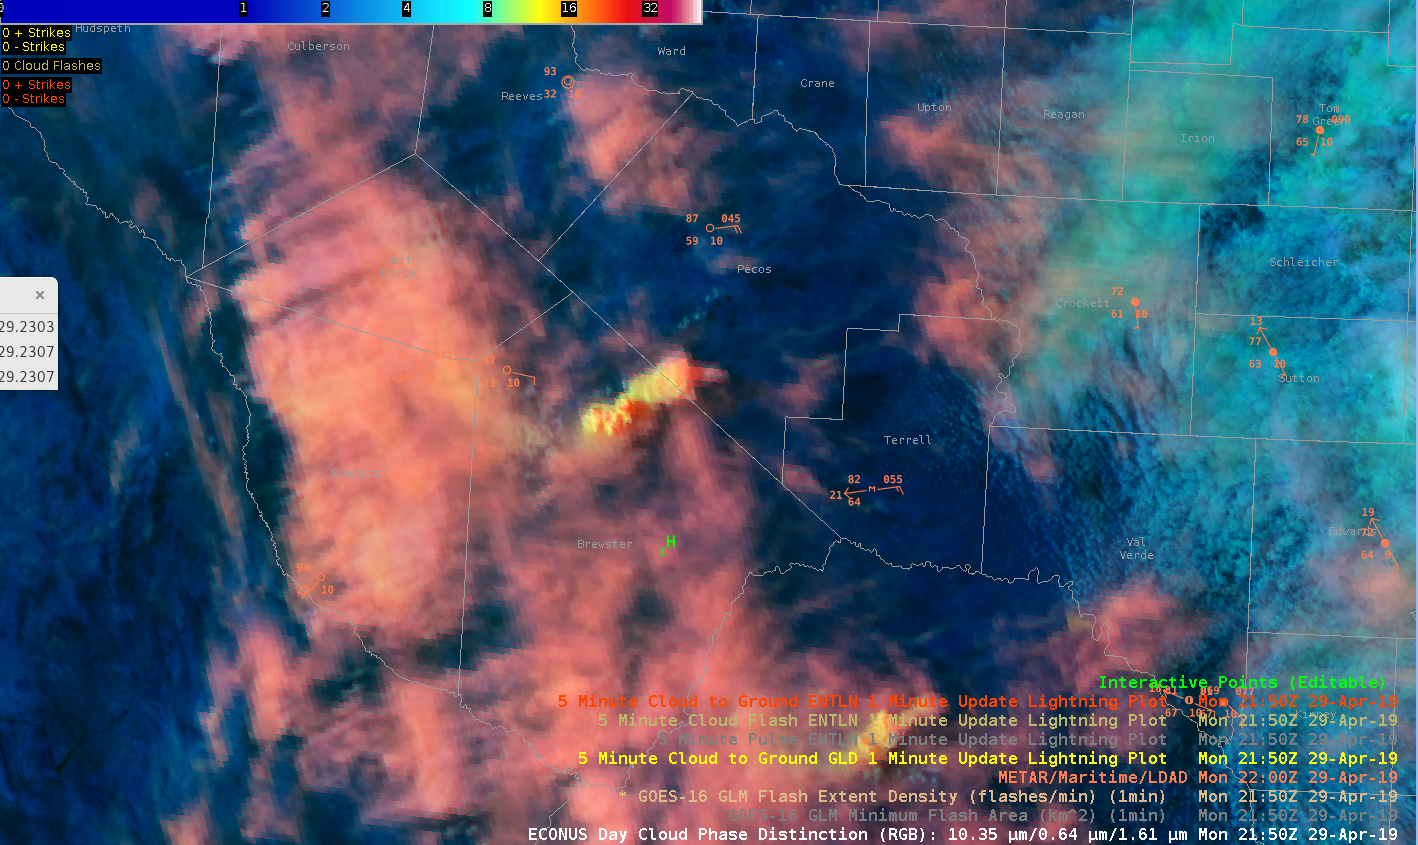
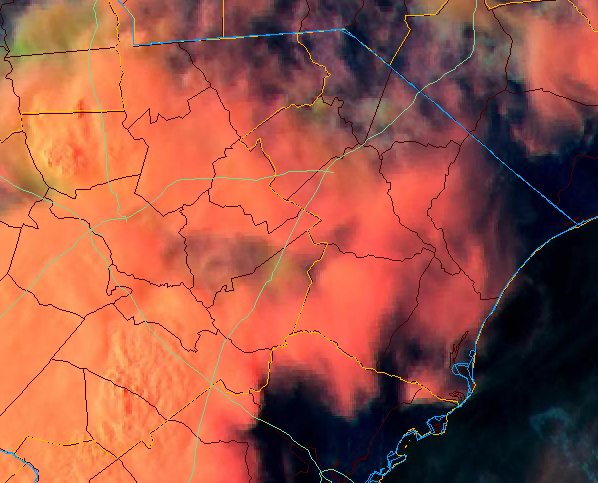
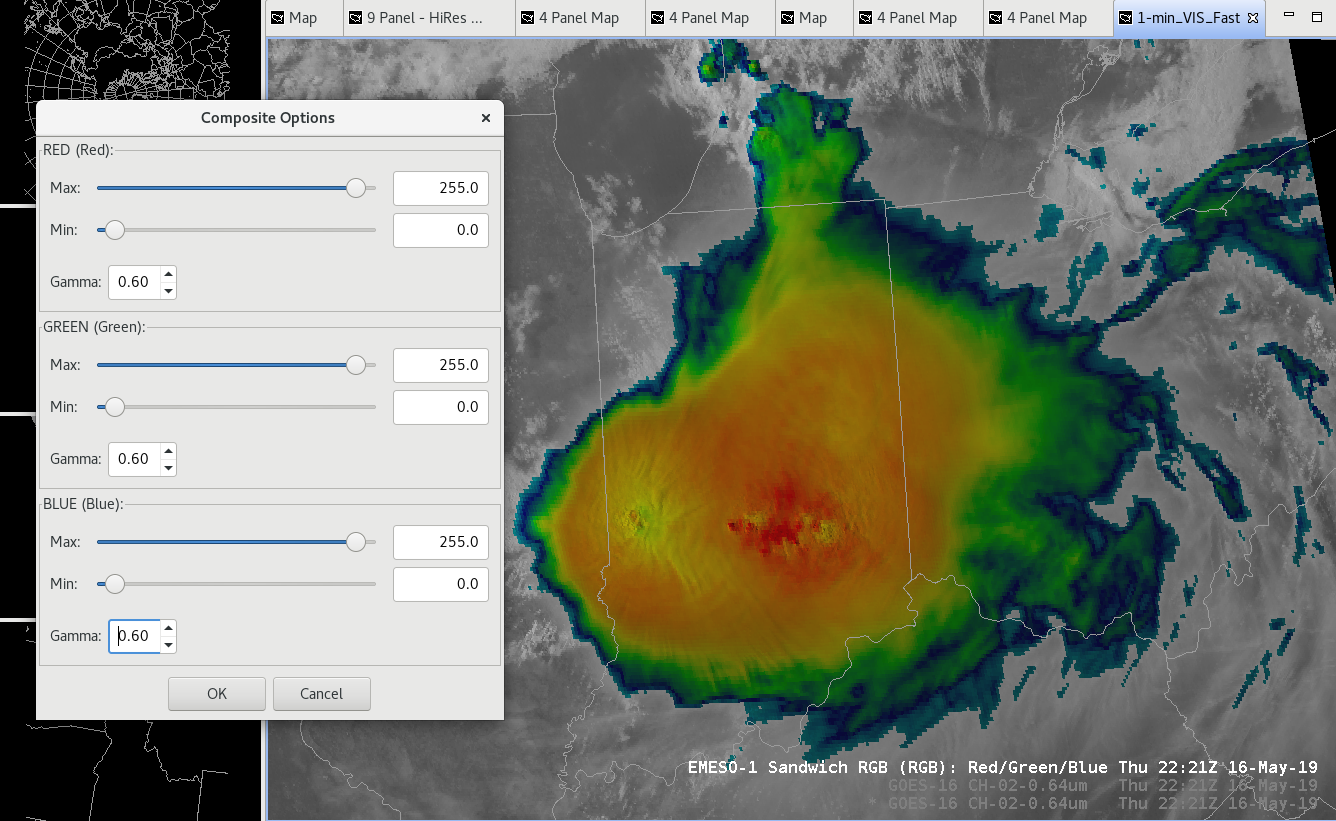
Day cloud phase 1 min of the same storm. Does not get much better than this!

-Dusty Davis

Brewster Co TX storm not so Punky but modified NUCAPS was

The modified NUCAPS sounding over Brewster Co TX was more representative of the actual conditions at 20Z versus the regular NUCAPS. A dryline was positioned very near the point of interest and convective initiation eventually occurred  near the boundary in ~1000 ML CAPE air around 22Z.

Modified NUCAPS sounding w/ surface Td near 47F. MLCAPE ~ 1000 J/kg.

Regular NUCAPS sounding w/ surface Td near 54F. ML CAPE ~2000 J/kg.

RTMA Td analysis. Point H is where the NUCAPS sounding was taken from.

GOES-16 RGB at 2150Z showing CI occurring near the dryline.