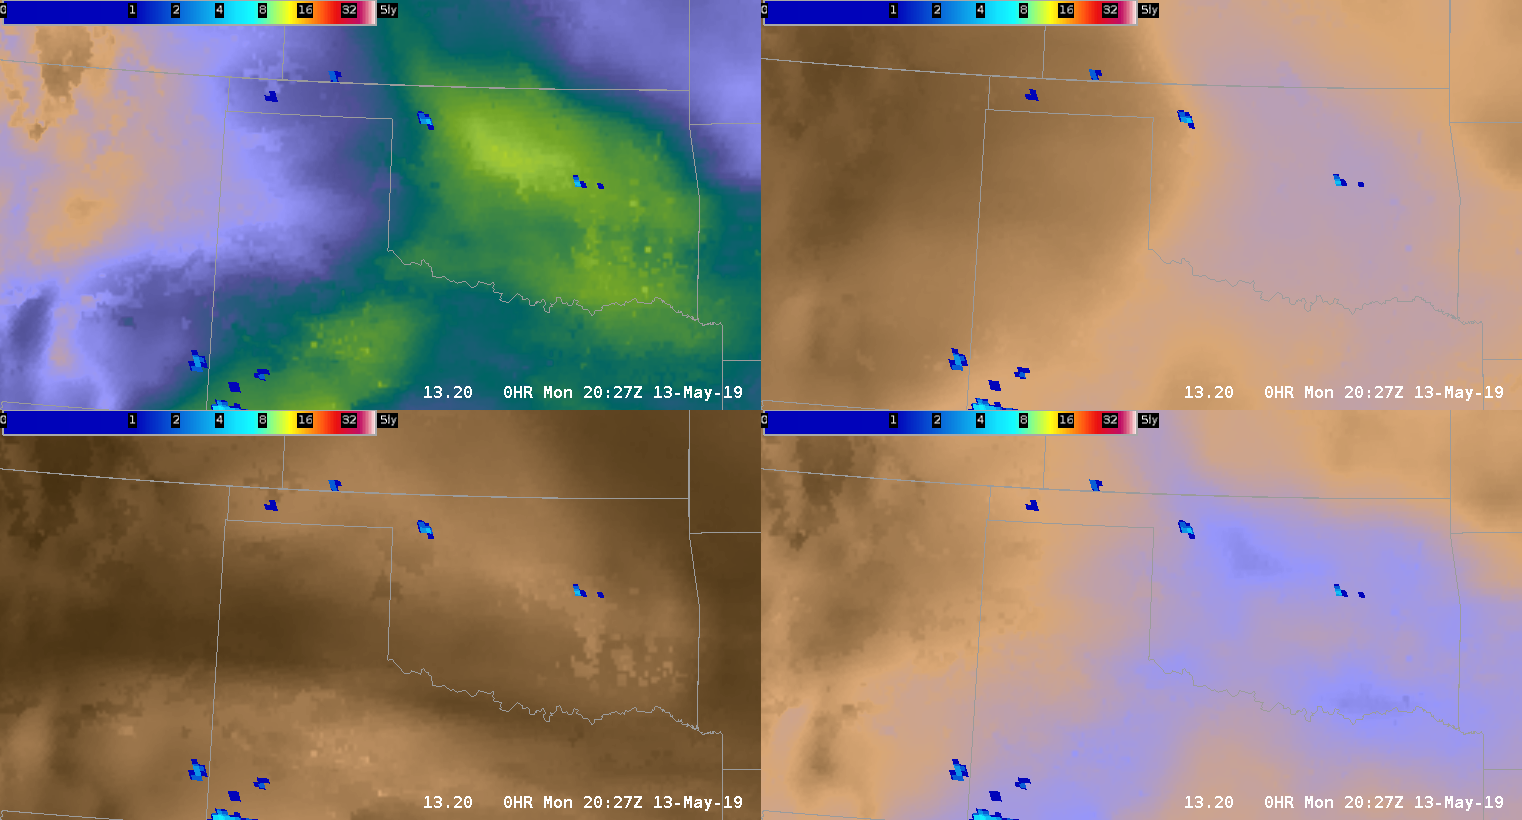
Convection began along a low level PW gradient across NW OK per GLM Flash Extent Density. Expected forecast: Based on steering flow, the storms should move into a more moisture rich environment and expand in coverage.
2027Z Upper Left: TPW, Upper Right: Sfc to 0.9 sigma PW, Bottom Right: 0.9 to 0.7 sigma, Bottom Left: 0.7 to 0.3 sigma PW
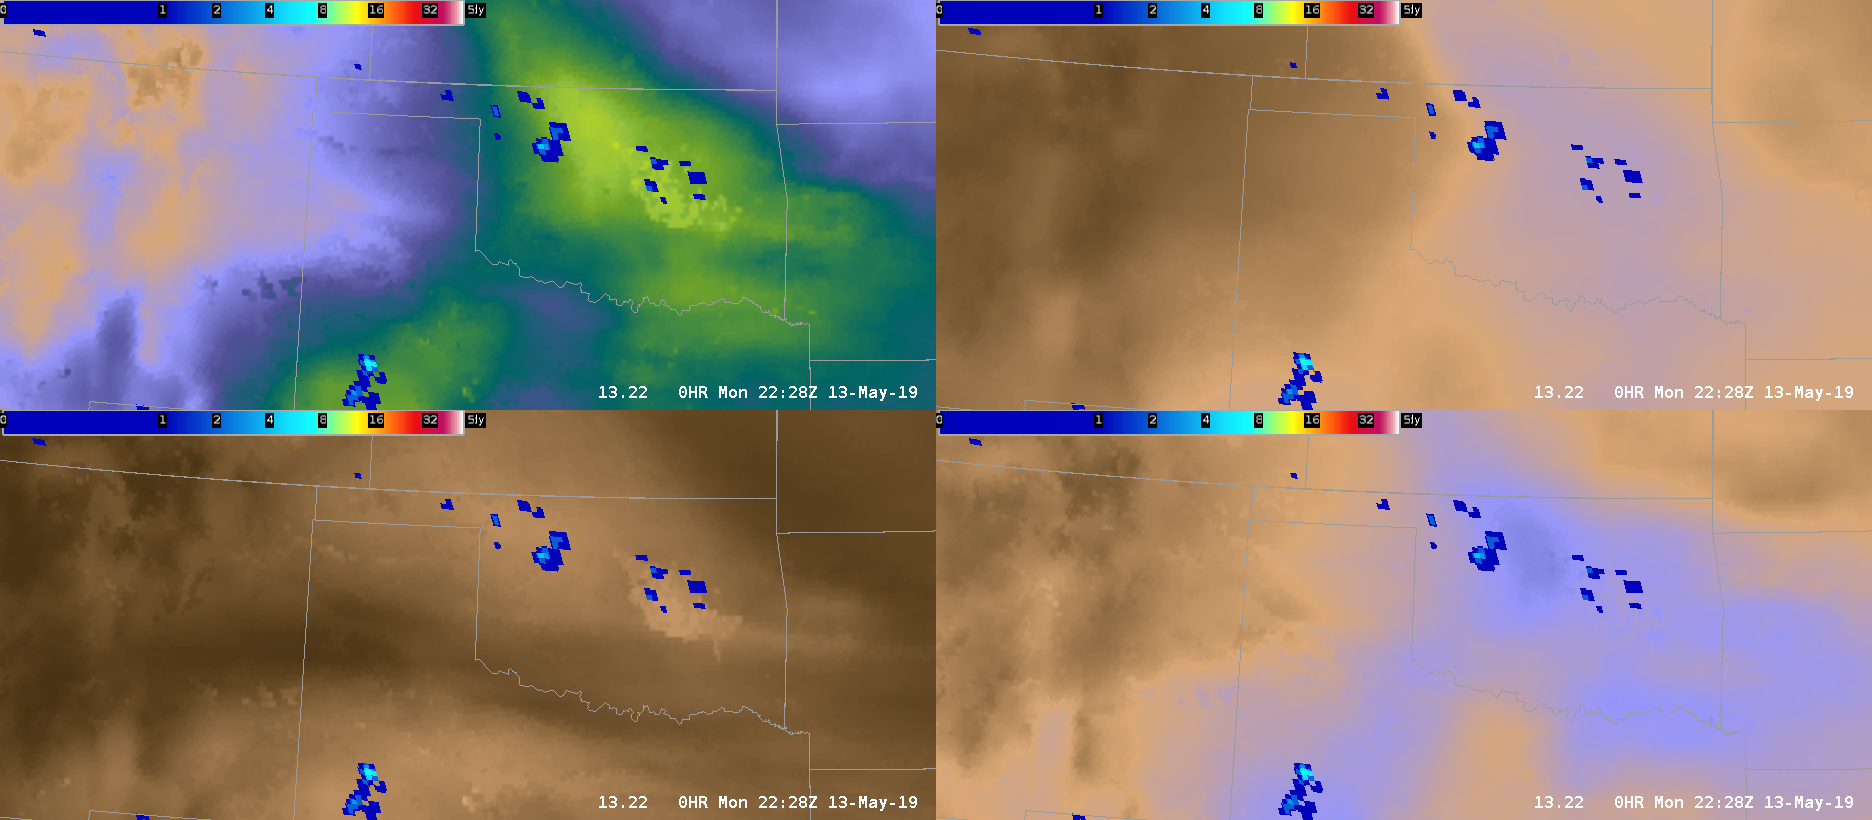
A little while later…Storms continued to expand eastward along the gradient into the more moisture rich environment.
2228Z Upper Left: TPW, Upper Right: Sfc to 0.9 sigma PW, Bottom Right: 0.9 to 0.7 sigma, Bottom Left: 0.7 to 0.3 sigma PW
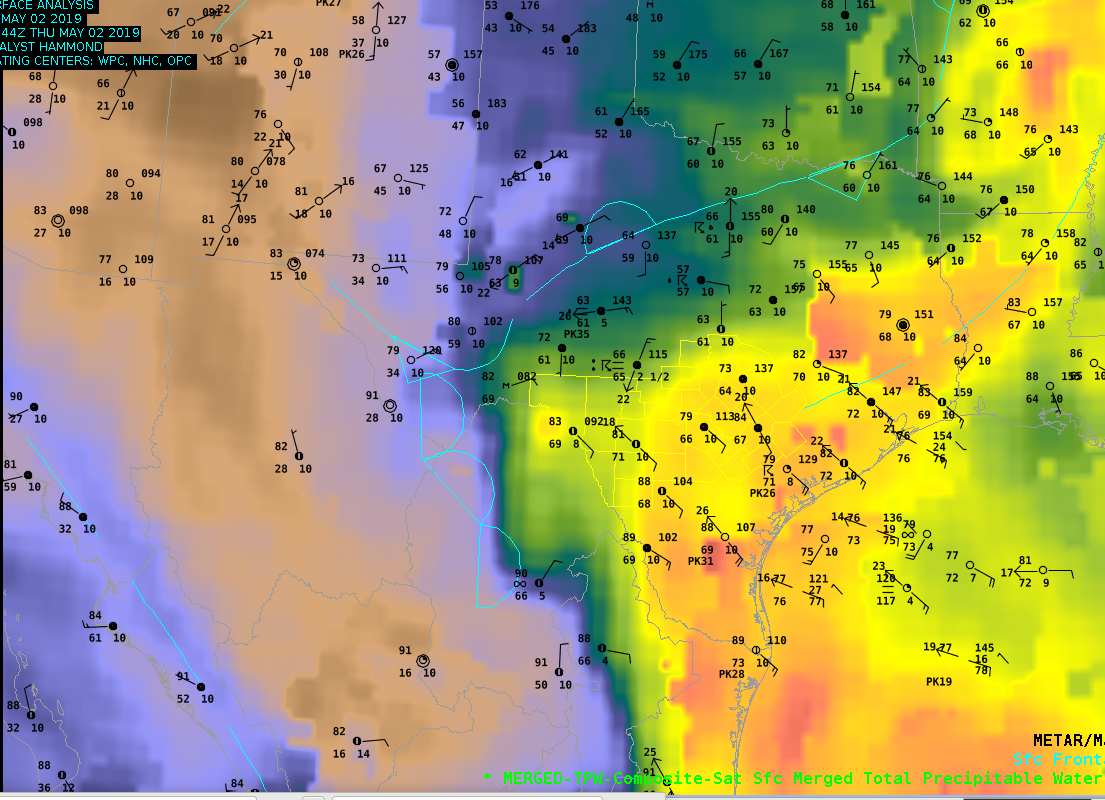
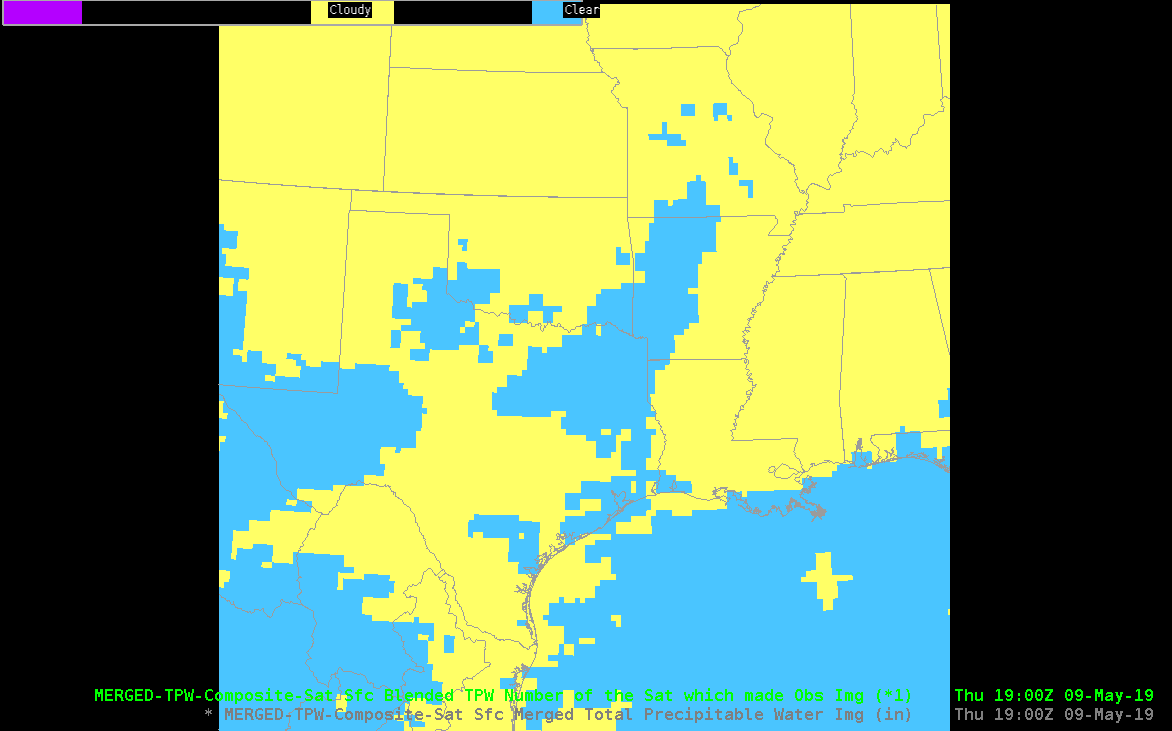
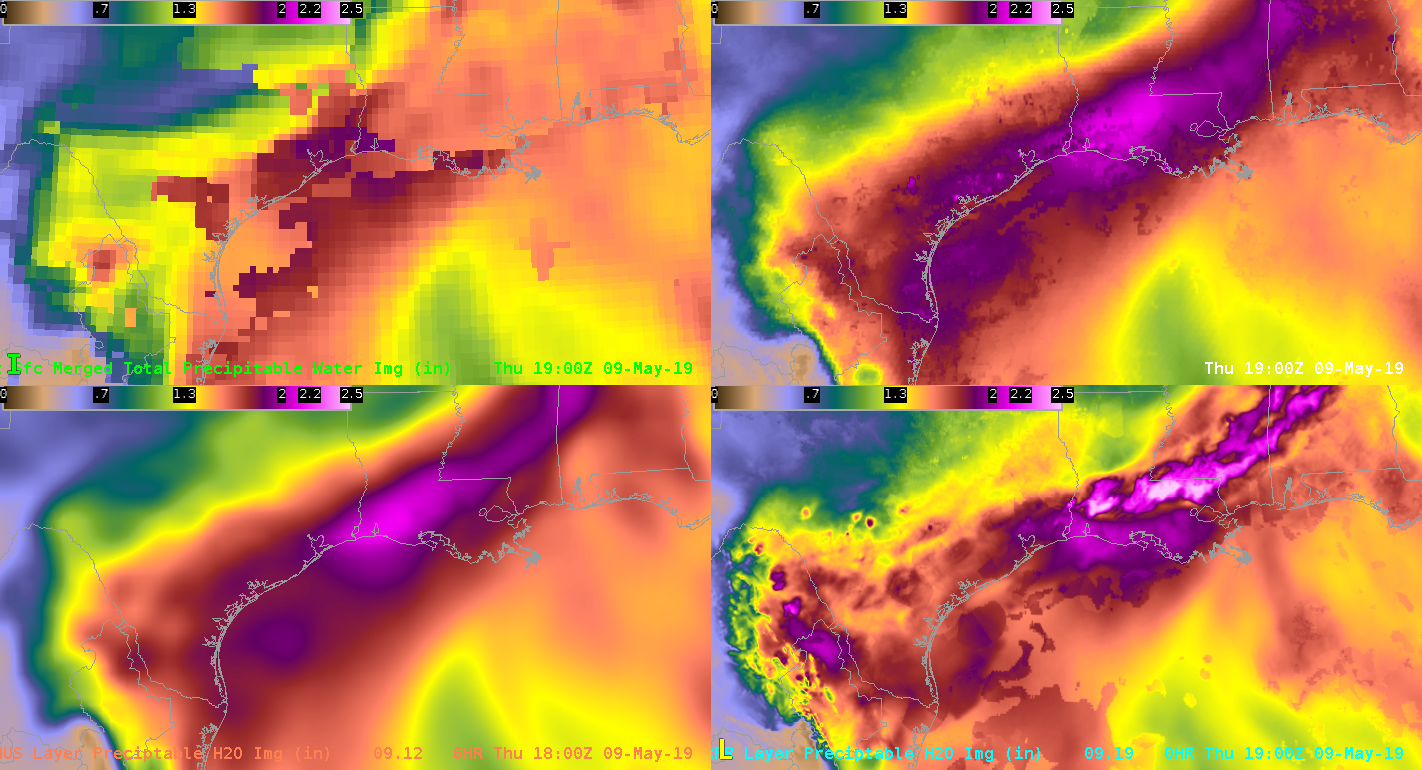
After making some adjustments to the color scaling, we’re able to mix model and analysis products of TPW. The GOM was mostly clear, while clouds covered most of the land. A very moist airmass was onshore, the Hammond LA GPS site measured 2.25″ of TPW.
The GFS and HRRR forecasts both indicated this maximum. The All-Sky LAP also did well, although it’s field is a reflection of the good GFS forecast. The Merged TPW did not generate these very large purple values (> 2″ of TPW) except in a very small area. The polar orbiter TPW retrievals used in Merged TPW must not have sampled these large values to advect in. The operational blended TPW (which relies heavily on GPS sites for the analysis over land) also showed a maximum. This points to the possibility that including the surface GPS network into Merged TPW and All-Sky LAP might be a way to increase the precision of these analyses.
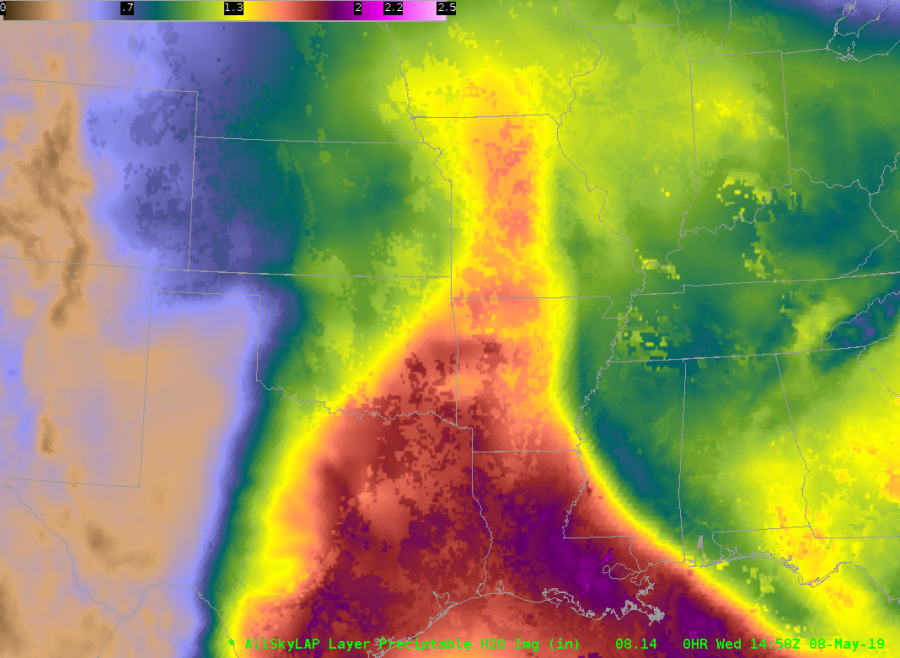
We’ve seen a couple of cases where the All-Sky LAP TPW surges back and forth unrealistically over a half hour intervals. Here are three frames 1/2 hour apart from 1458 / 1528 / 1557 UTC 8 May 2019. Note the surging TPW over the eastern OK / northwest AR region.
1458 UTC
1528 UTC
1557 UTC
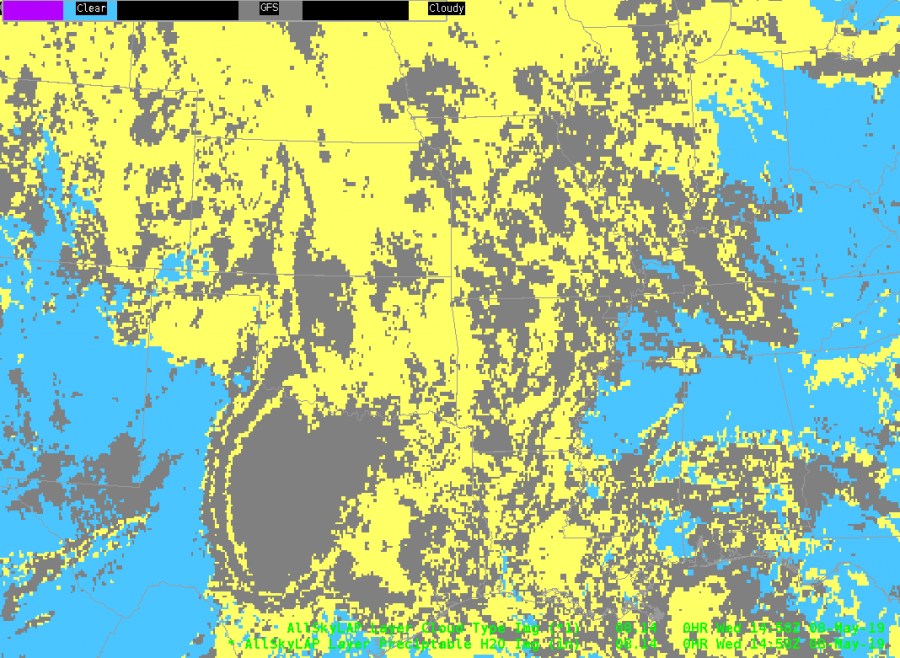
1458 UTC Data type (yellow / gray cloudy)
The data type indicates this is in a cloudy region. What’s odd is the middle frame is different, then the last frame is more like the first. Perhaps this is related to handling of the new 12 UTC GFS cycle?
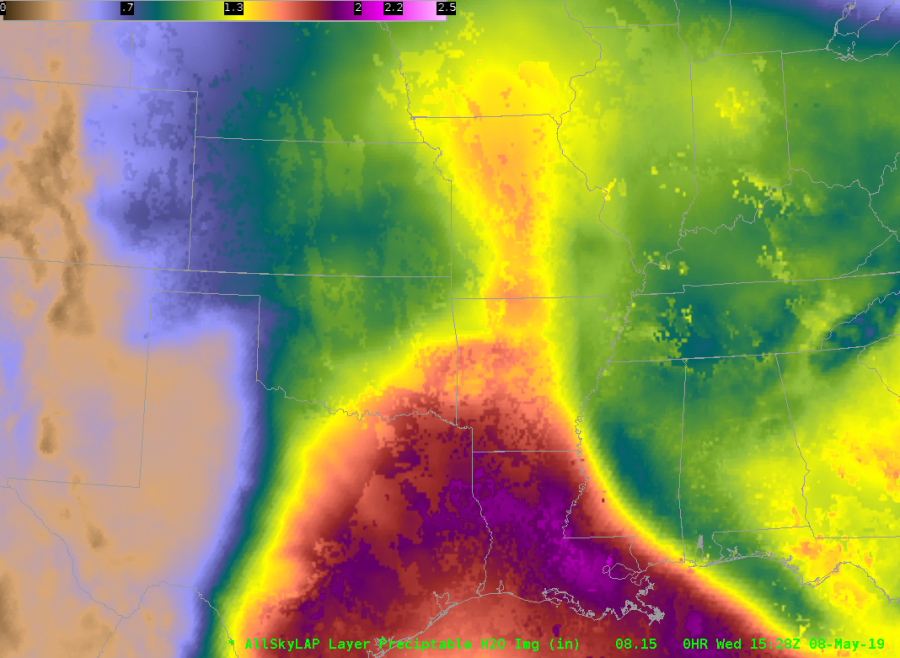
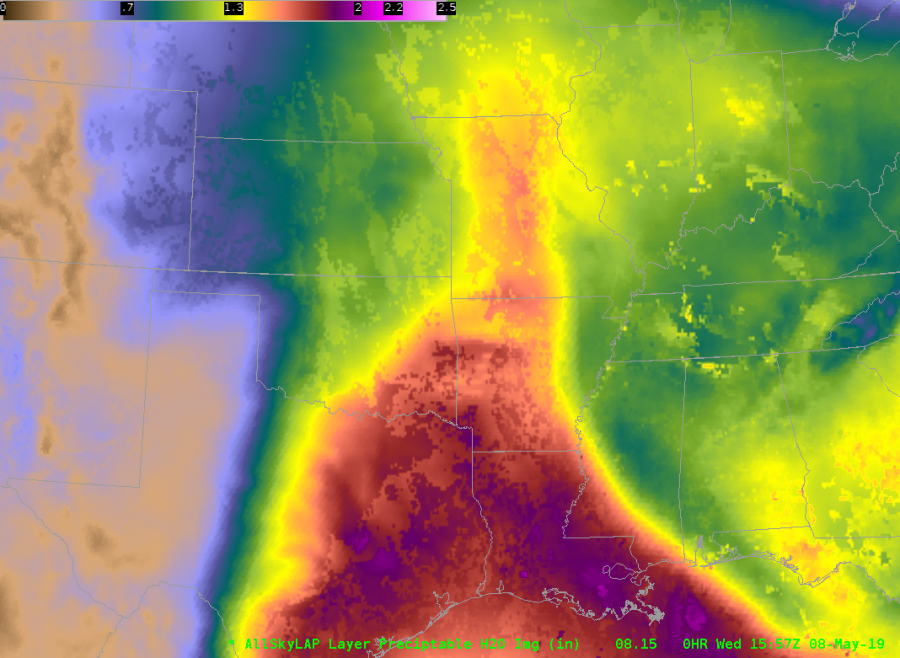
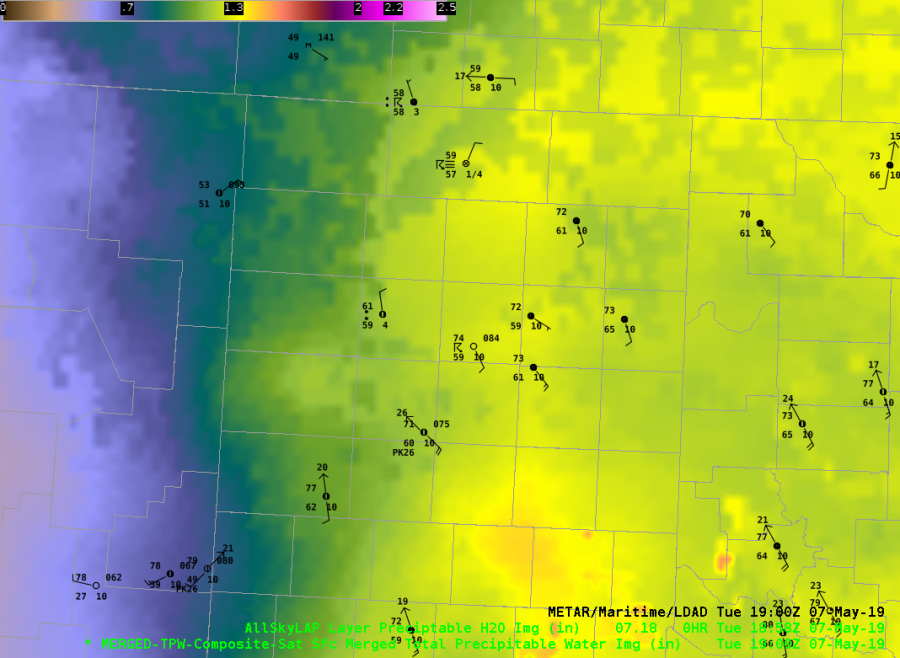
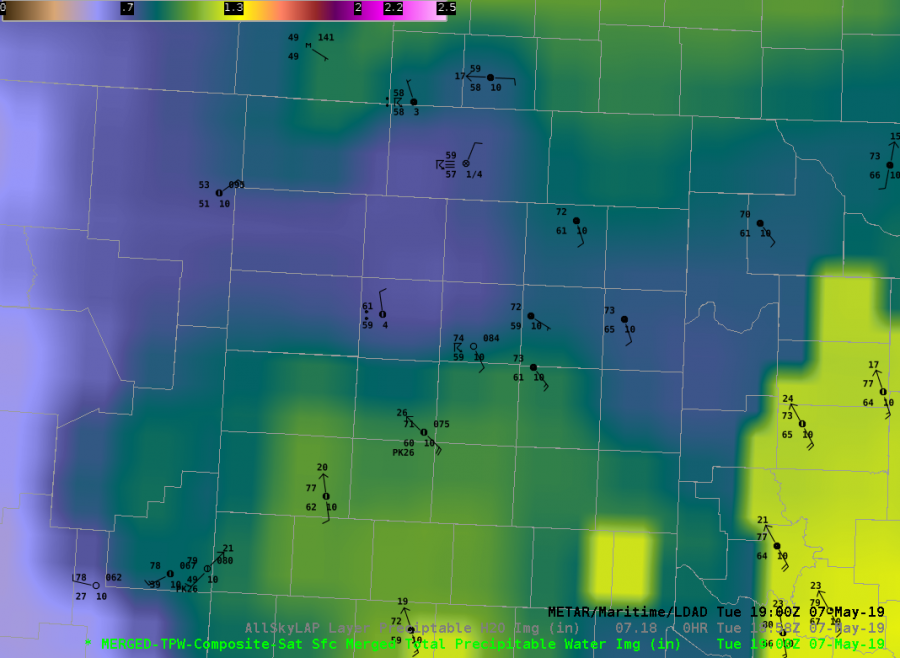
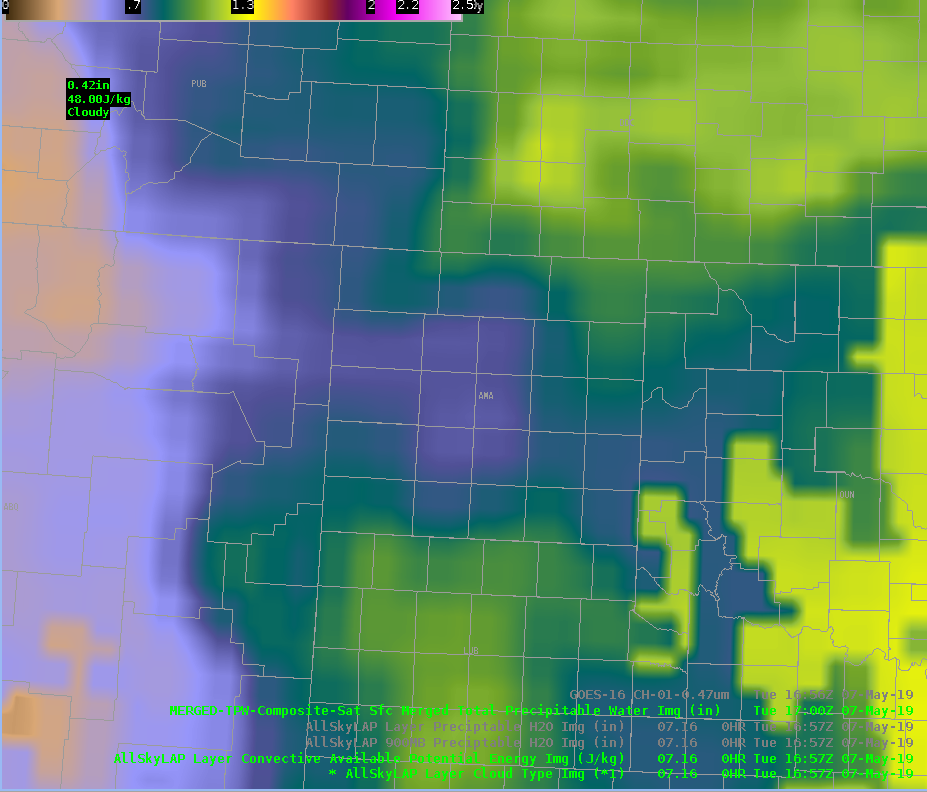
The CIRA Merged TPW and All Sky LAP in the TX panhandle show some differences in the vicinity of the dryline at 19 UTC on 7 May. This is a cloudy region so the retrievals are either GFS (All Sky LAP) or advected polar microwave (Merged TPW), The All Sky LAP TPW shows a moist panhandle, with values in green / yellow (1″ or above). The Merged TPW indicates lower values in green / purple, or about 0.7″. Surface dewpoints range from 59-65 F, indicating moist air ahead of the dryline.
Surface GPS observations from Suominet at three TX stations in the panhandle (Amarillo – 1.0″, Borger – 1.0″, and Canadian – 1.1″) lean closer to the All Sky LAP analysis. An hypothesis for the Merged TPW being low is dry retrievals from higher terrain to the west being advected into the moist sector.
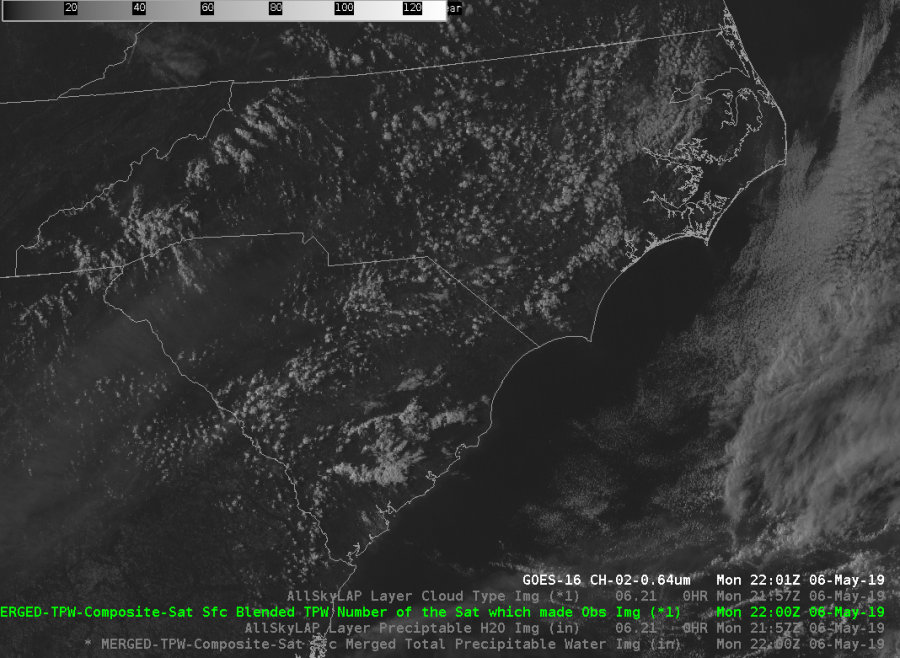
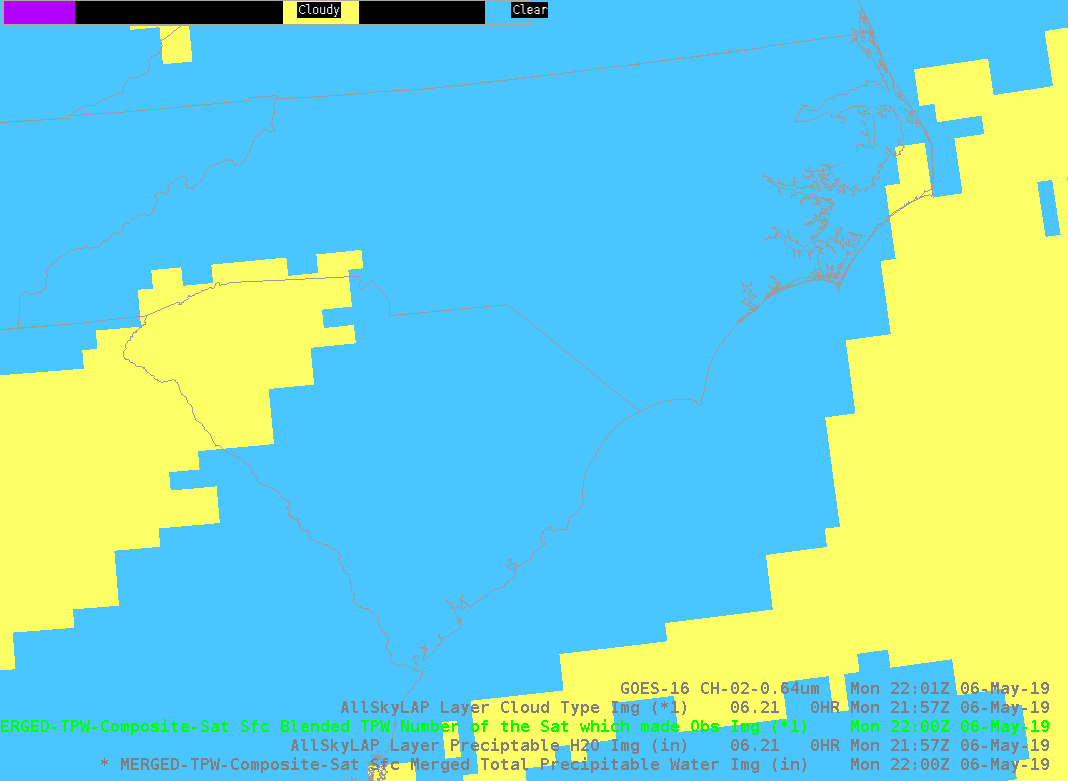
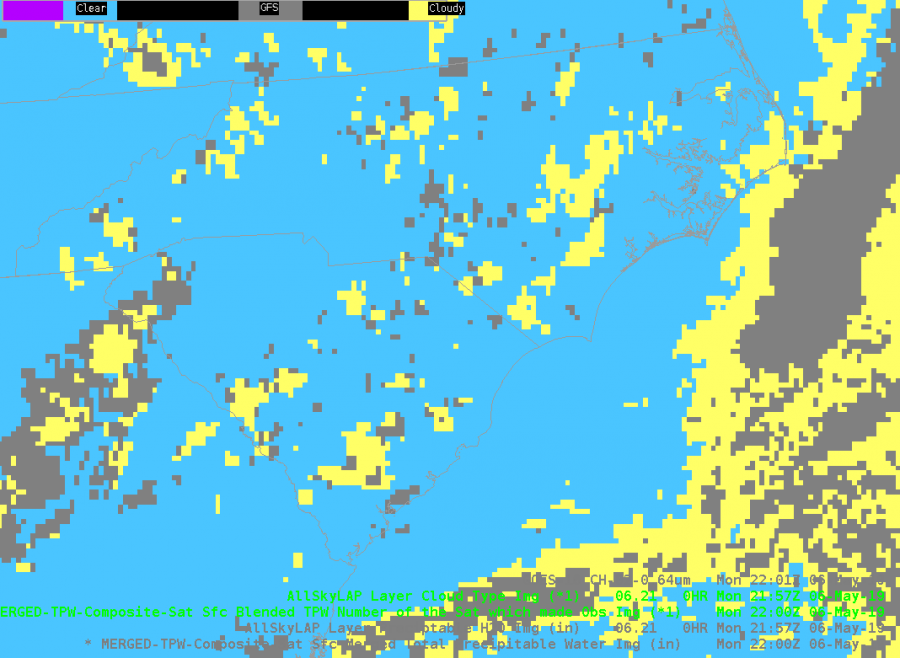
At 22 UTC on 6 May 2019, the All Sky LAP and CIRA Merged TPW Data type products show differences in the cloud mask. A shallow Cu field over NC / SC is indicated in GOES visible imagery,. The data type masks of the two products (blue = clear; yellow / gray = clouds) show some clouds in the All Sky LAP mask, while the CIRA Merged TPW mask does not have these Cu detected. This is likely due to the lower resolution (~ 15 km) of the GOES-16 TPW data used in Merged TPW versus the All Sky LAP resolution.
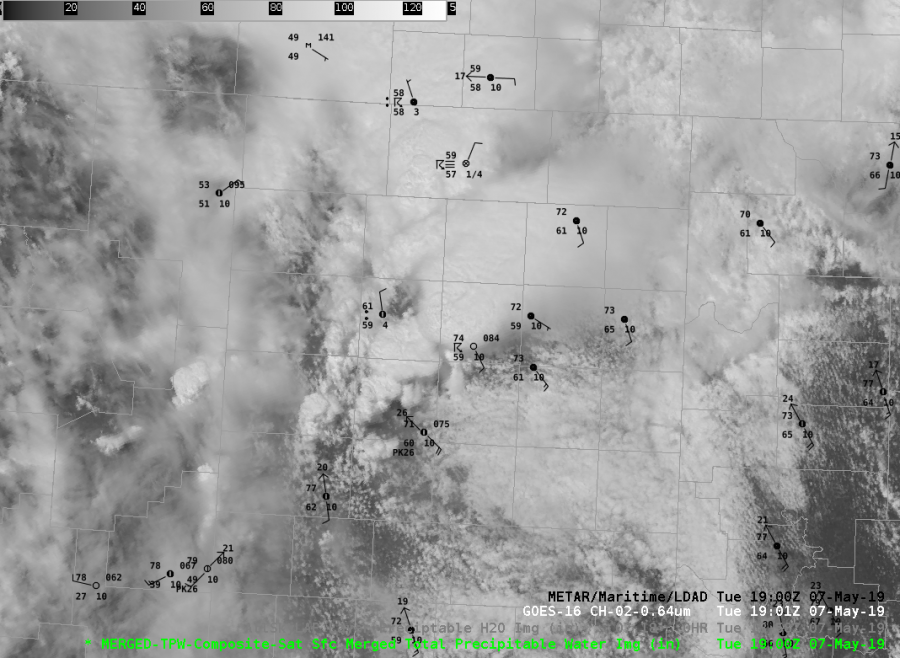
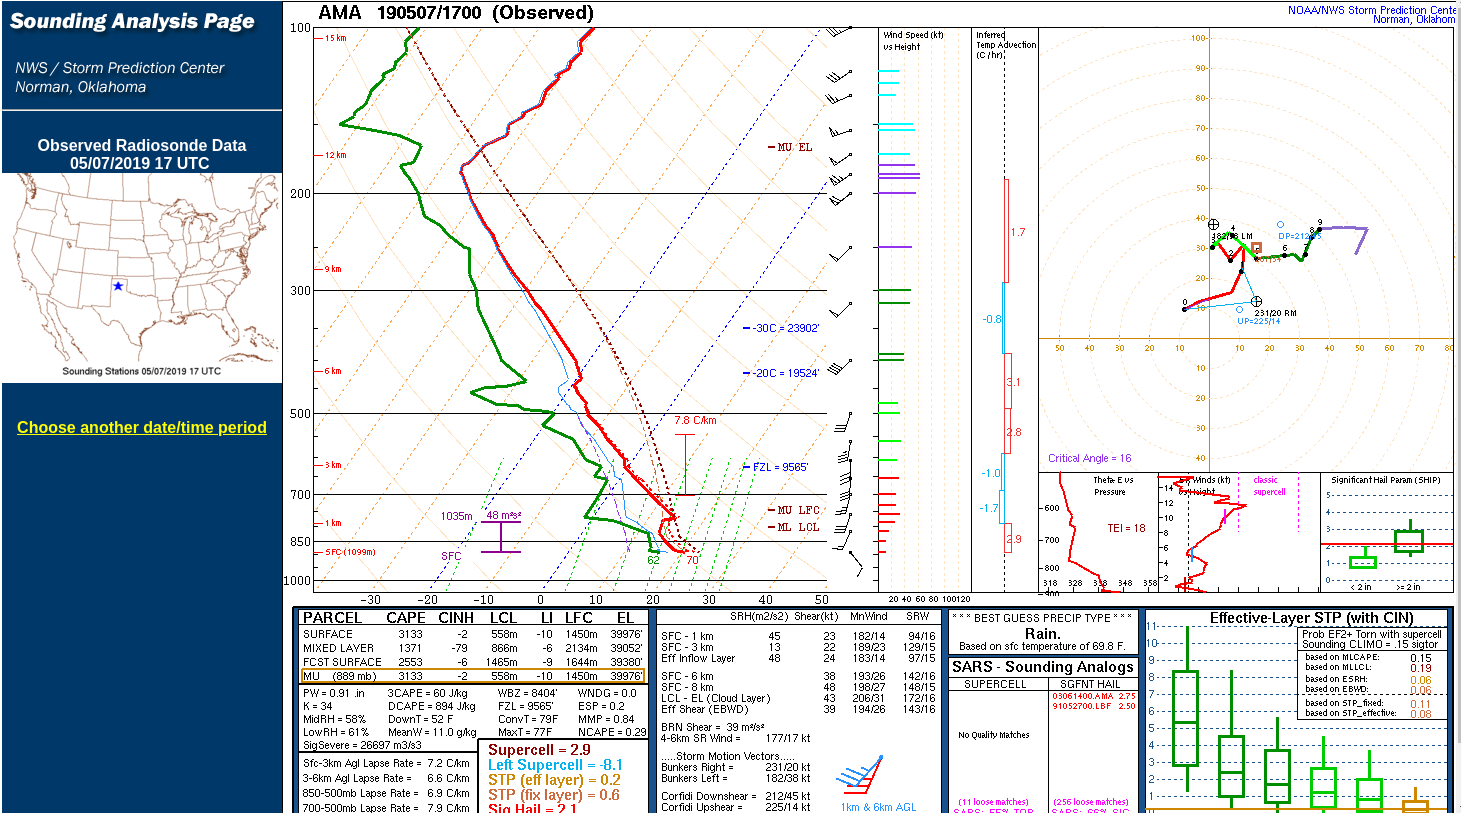
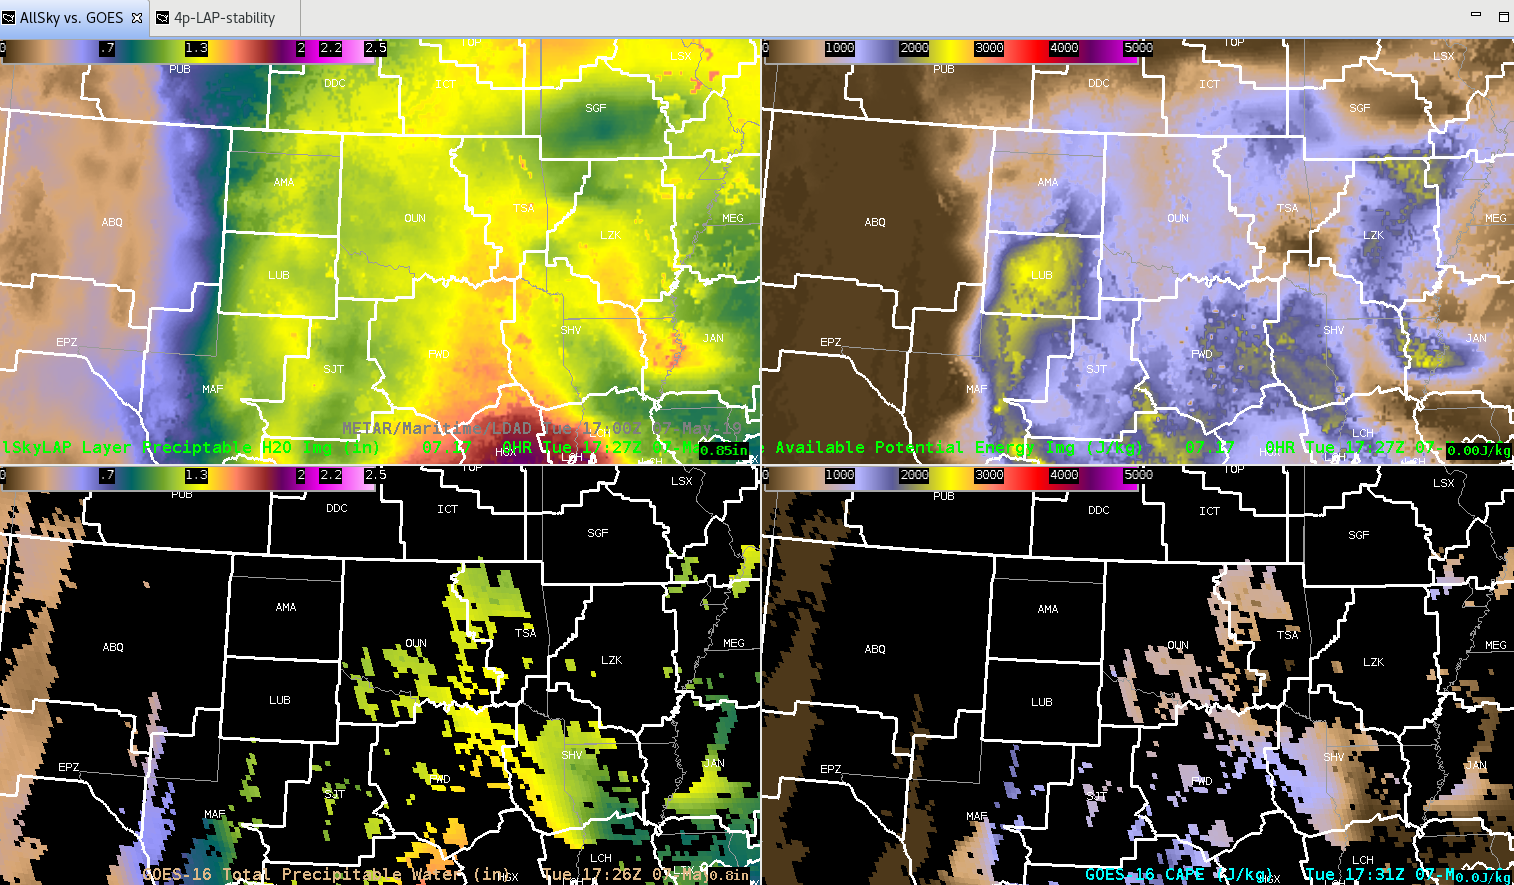
Noticed a major difference in the pre-storm environment at 17Z, just before convective initiation, between the TPW and LAPS products Total Precipitable Water Products. AllSkyLAP Total Precipitable H20 was observing ~1.25″ at 17Z whereas the Avd. Blended TPW observed ~0.7″ at 17Z. A special 17Z sounding observed 0.9″. While AllSkyLAP ‘looked’ more realistic from a mesoanalysis standpoint, the sounding was closer to the Adv. Blended TPW product. Would like to see more sounding verification between the 2 products.
One of the limitations of GOES TPW is that it will not display data when there is a significant amount of clouds in the area. AllSky Layer Precip is a great alternative to GOES TPW for areas that are experiencing clouds. The same goes for AllSky CAPE vs GOES CAPE. With a MOD Risk of svr wx today across the TX Panhandle, having the AllSky Data available greatly benefits forecasters today.
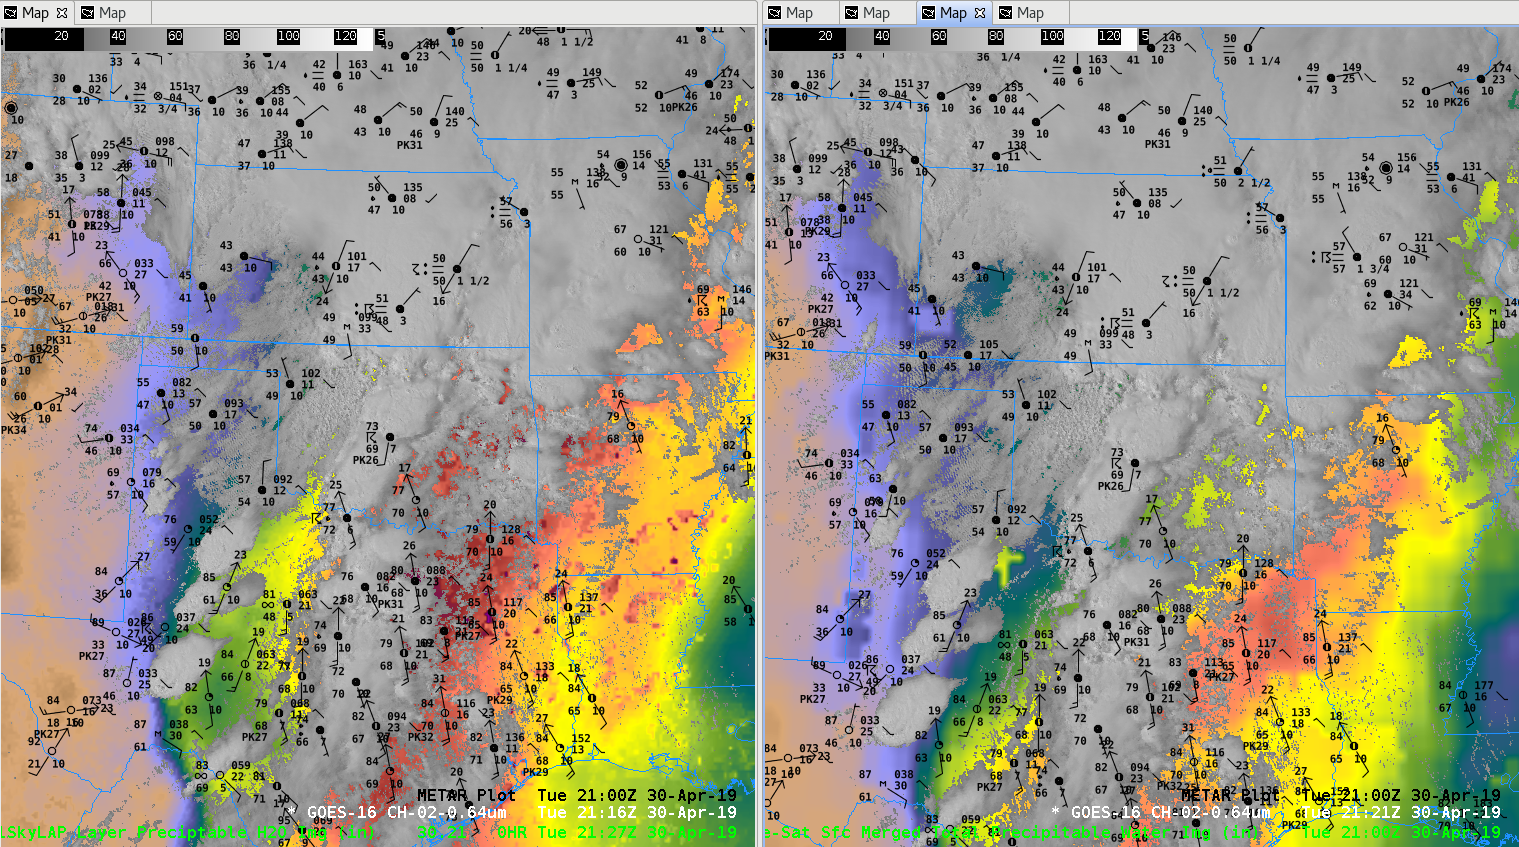
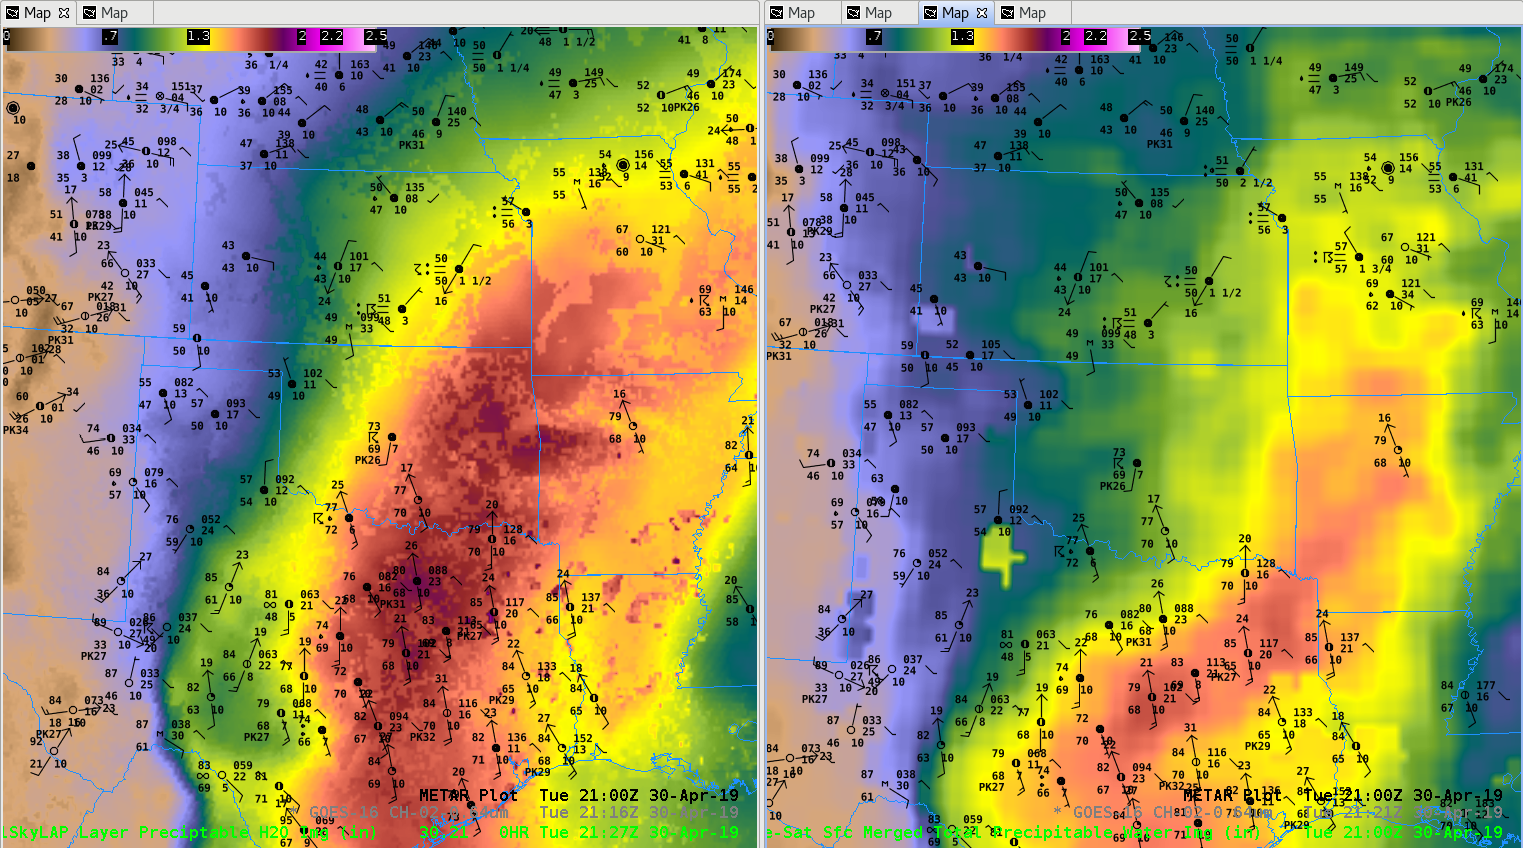
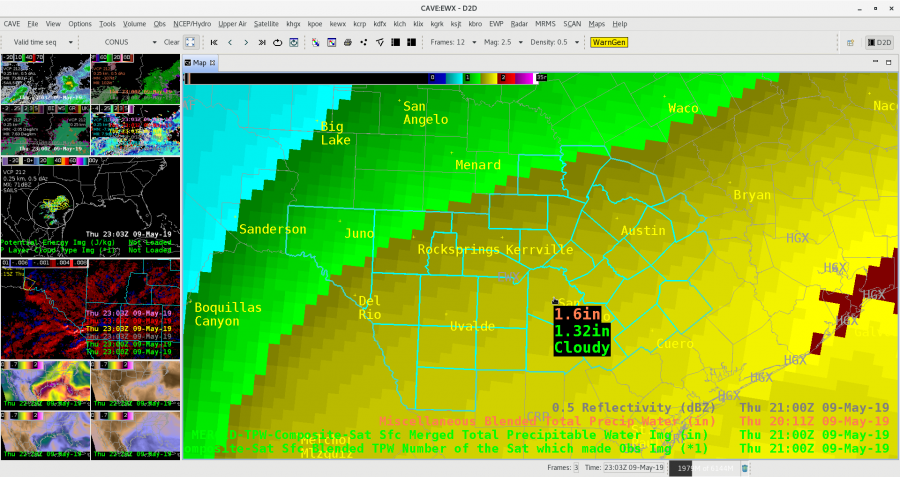
The merged-TPW product compared well to the surface obs with 1) the strong gradient along the dryline 2) the lower PWAT values behind the MCS and 3) axis of greater PWAT along the immediate Gulf Coast. Actual values however were too high in the dry air (MAF/DFW) and too low in the moist air (DRT/CRP). Values compared to 12Z soundings at BRO the best.
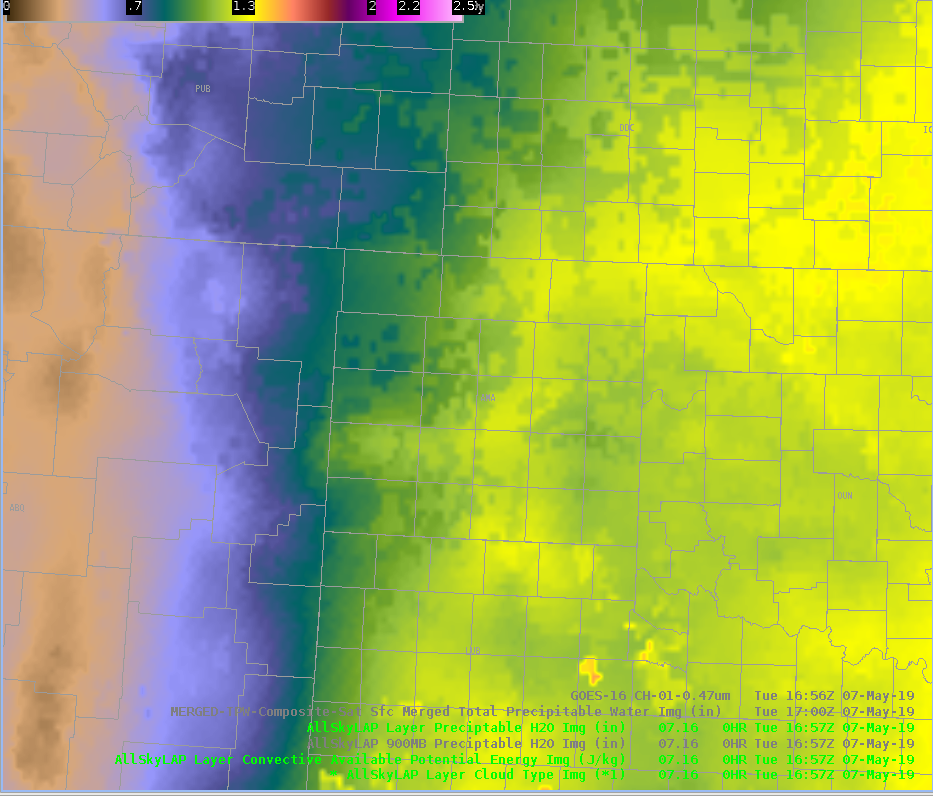
All Sky Total Layer PW did a better job in Figure A with western gradient of moisture where convection developed along dry-line compared CIRA Merged Total PW. All Sky also seemed to better capture the moisture plume through central Oklahoma into southeast Kansas.

 1528 UTC