Use of Cloud Phase Distinction RGB to anticipate convective initiation over Western Dakotas and Eastern Montana

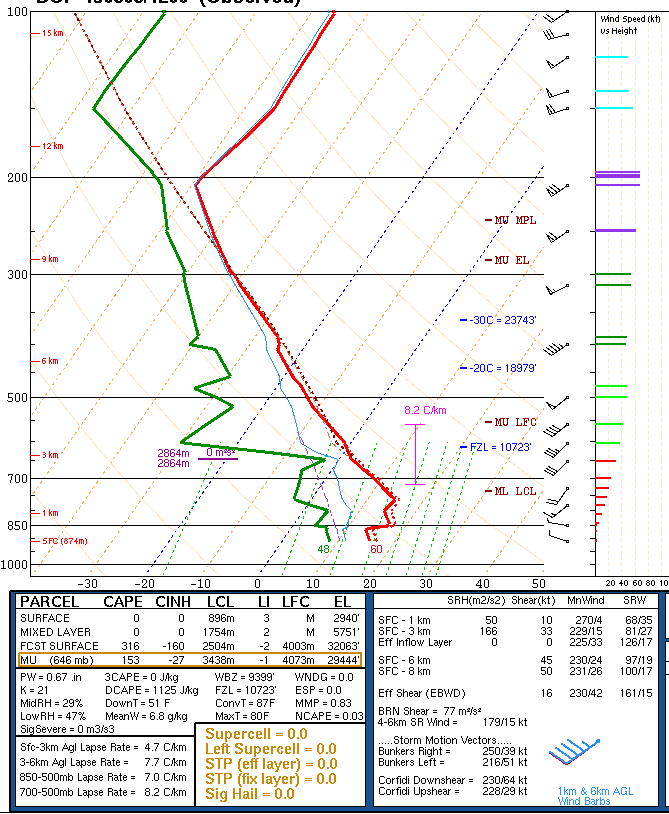
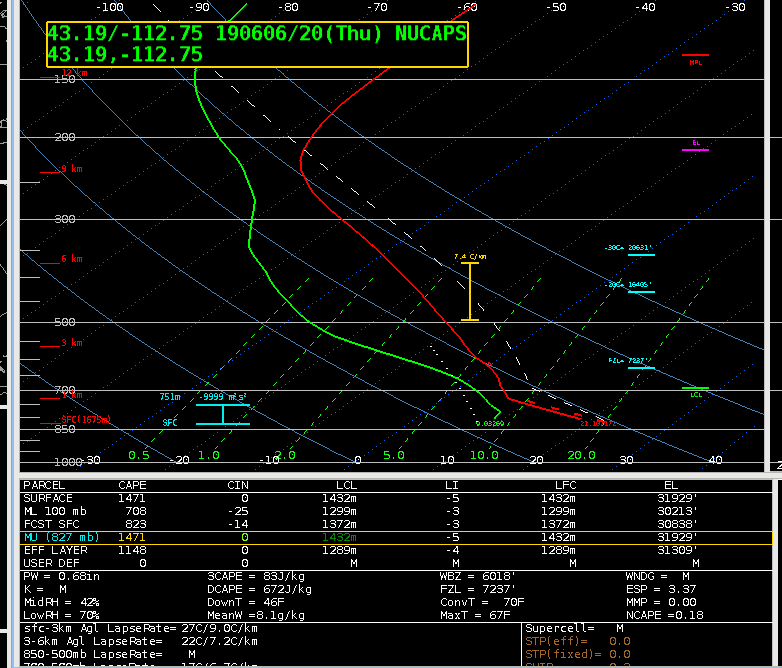
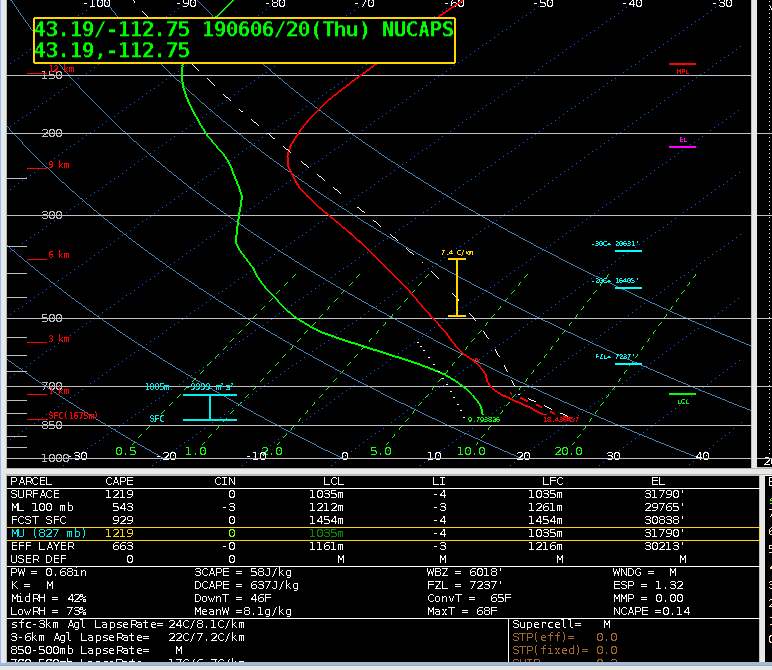
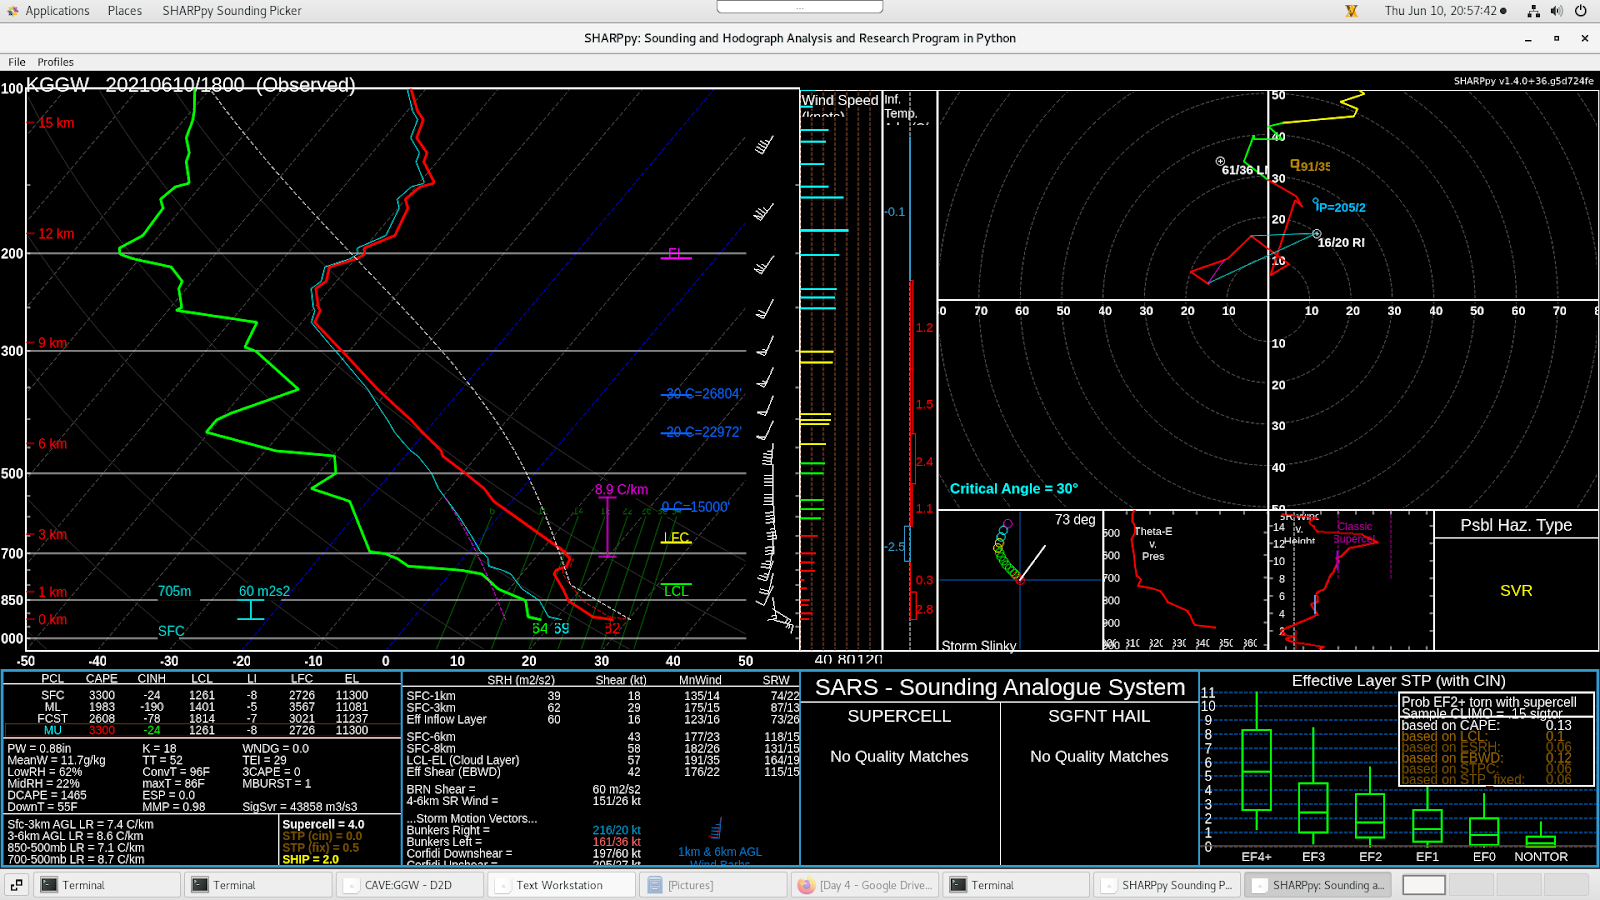
Some members of the 12z Thu Jun 10 HREF run were a bit slow in initiating convection or too far east in developing convection over the Northern Plains. The NSSL WRF-ARW was closest to reality with respect to exact timing and location. A special 18Z RAOB from Glasgow (GGW) MT and the Cloud Phase Distinction RGB proved to be very helpful in showing convection was going to develop earlier than anticipated by the HREF guidance. The 18Z RAOB from GGW (below) showed weak CINH values, while the Day Cloud Phase Distinction RGB (second graphic) showed an agitated cumulus field that was becoming quickly glaciated (single cell with yellow cloud top near the 93/61F sfc obs) indicating deep convective development was imminent.

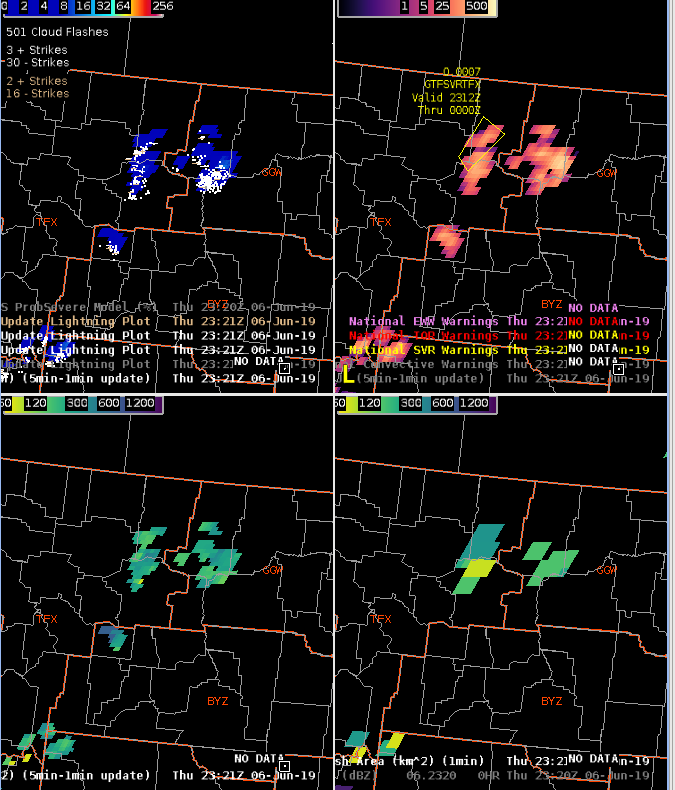
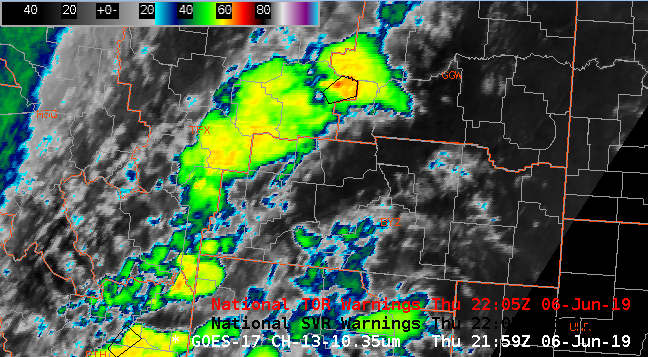
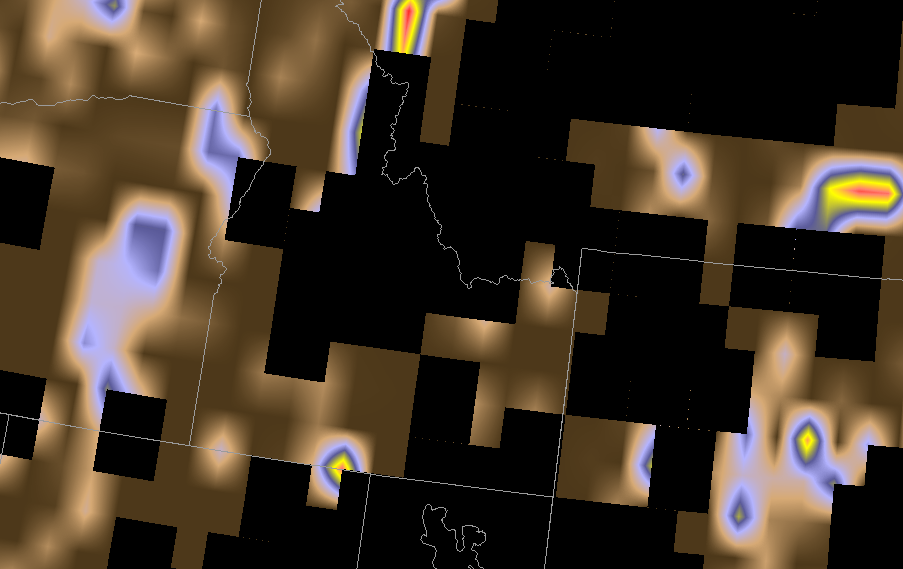
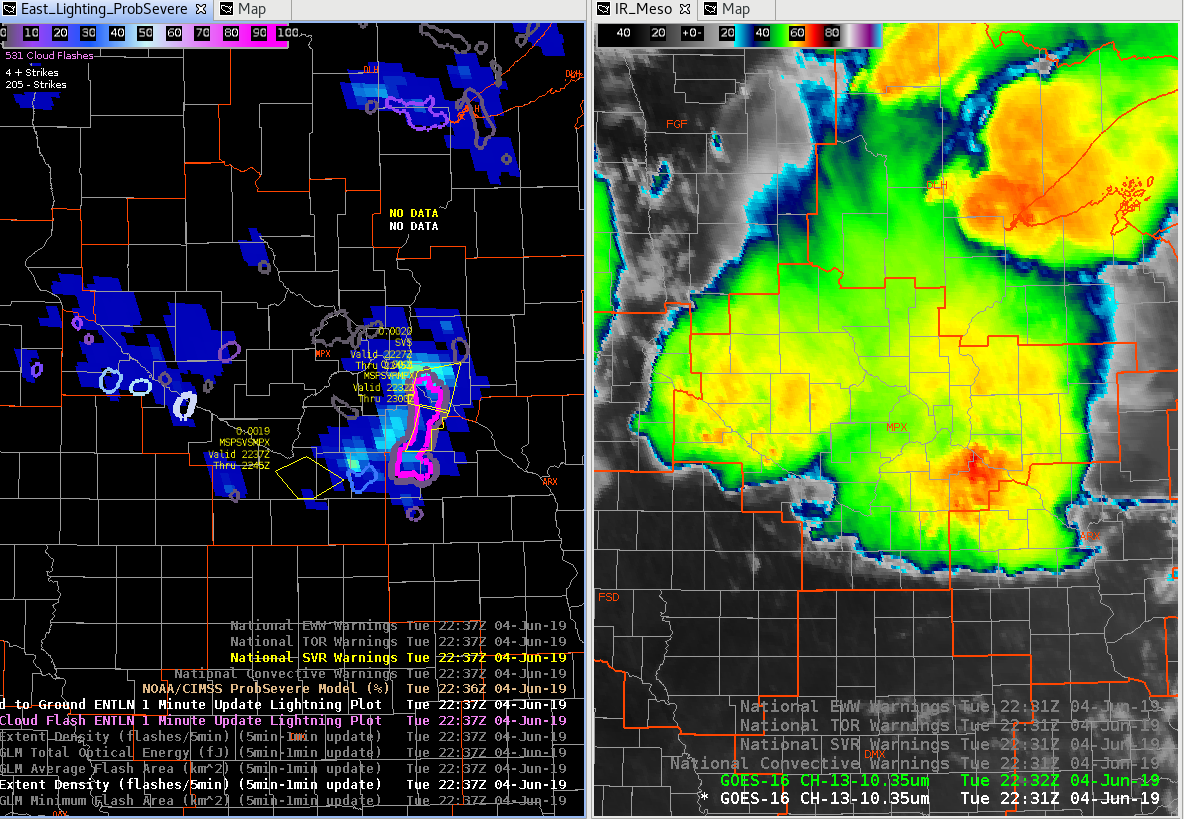
Once deep convection initiated, single channel ‘Clean IR’ imagery and Day Convection RGB became more useful in determining updraft strength. These two products can be extremely useful in severe weather detection and warning decision making especially in absence of radar and/or lightning data or when used combined due to its faster temporal coverage (1-min in meso sector vs 5-min from radar).

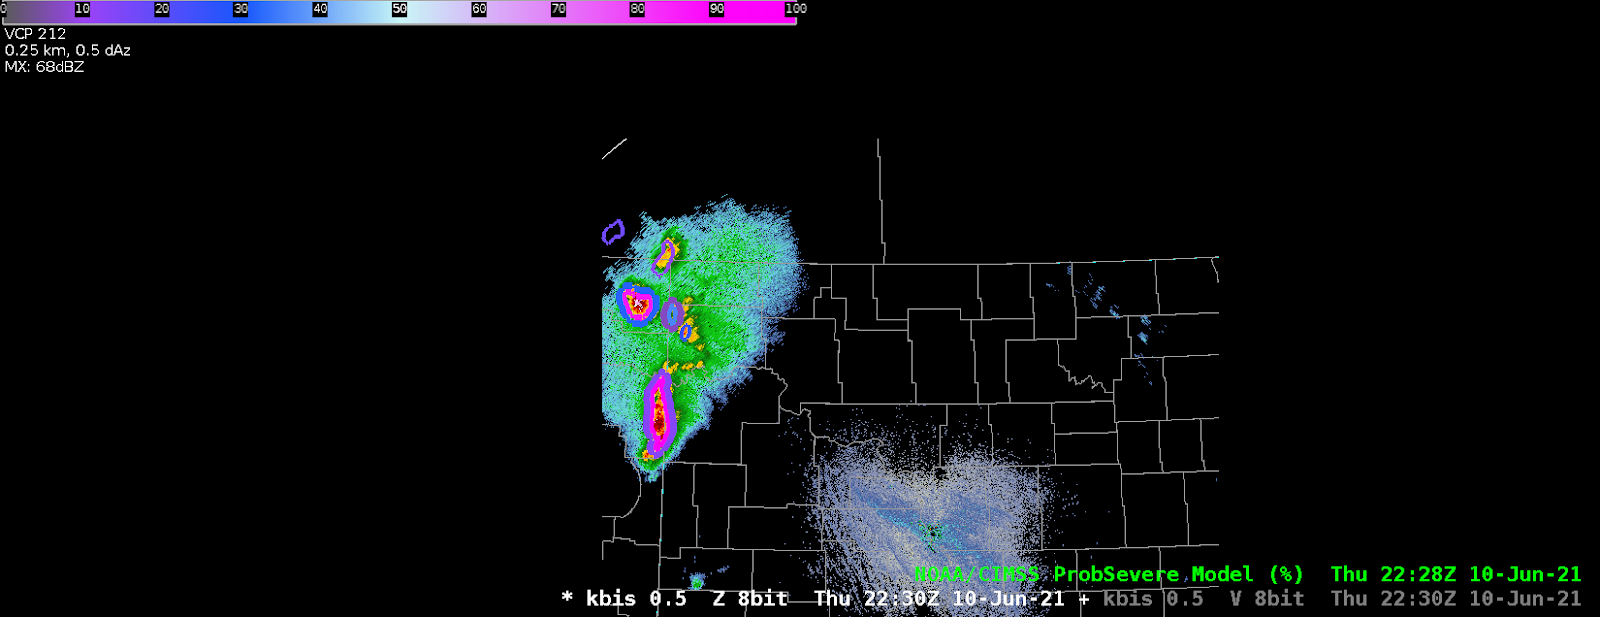
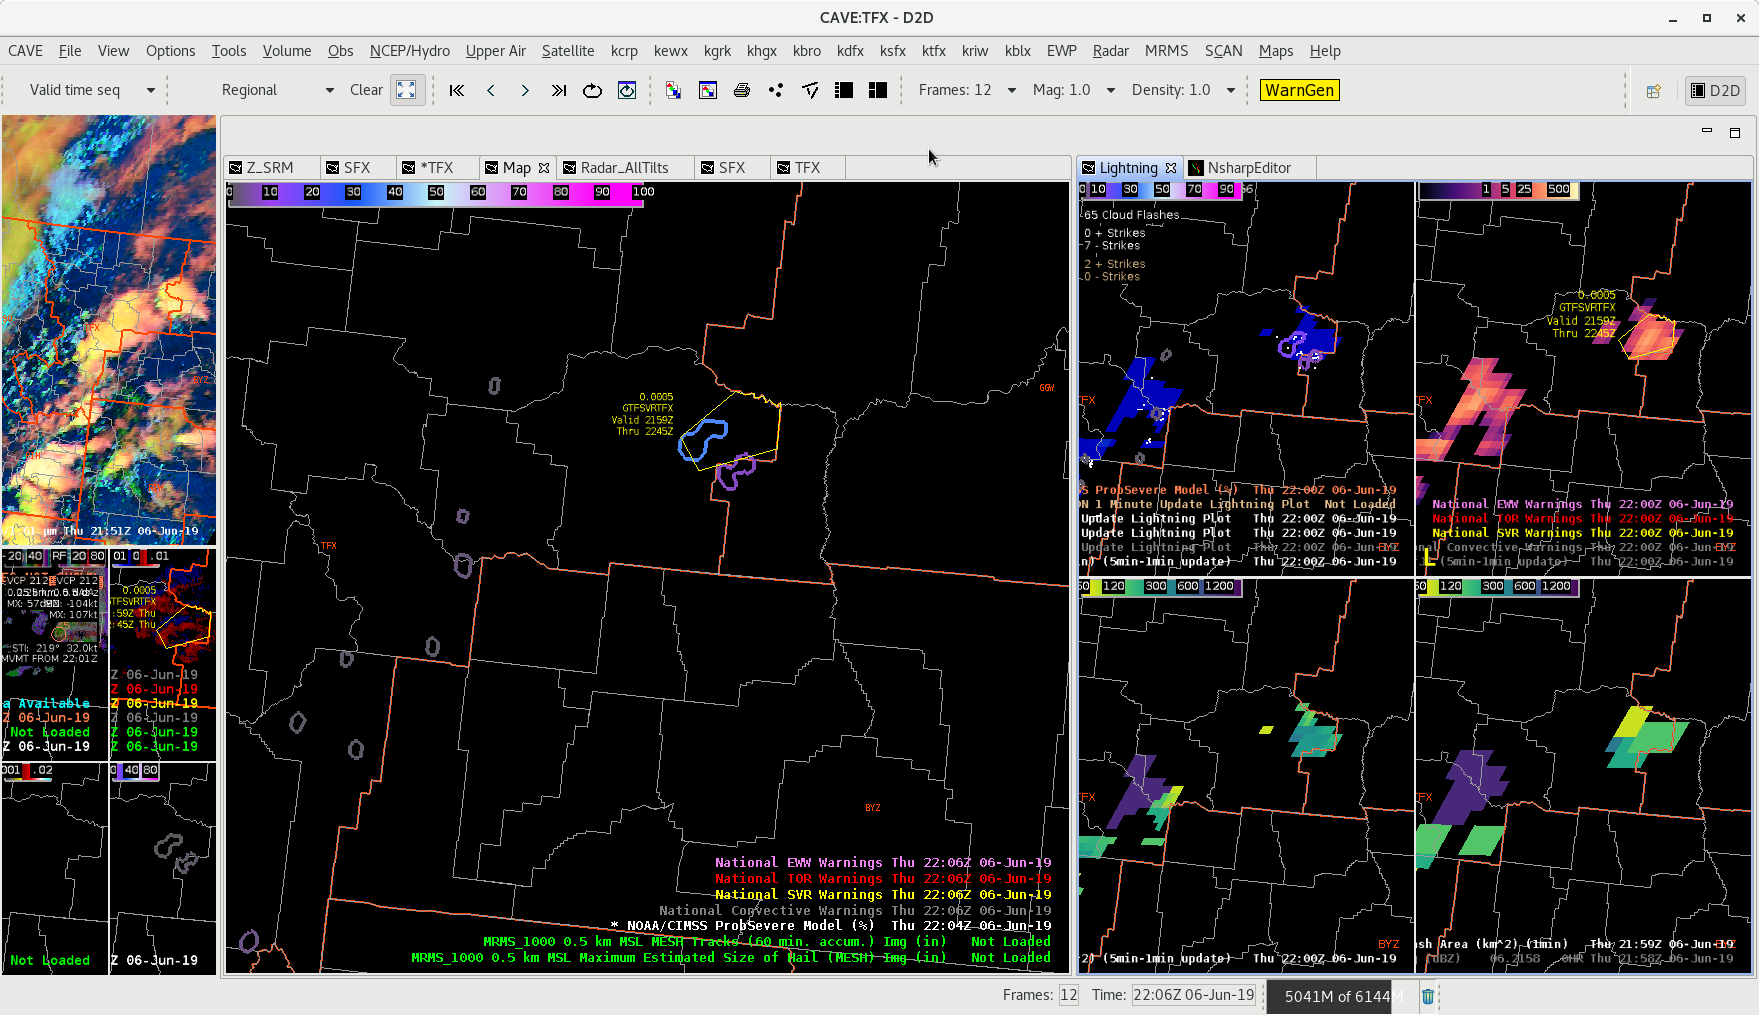
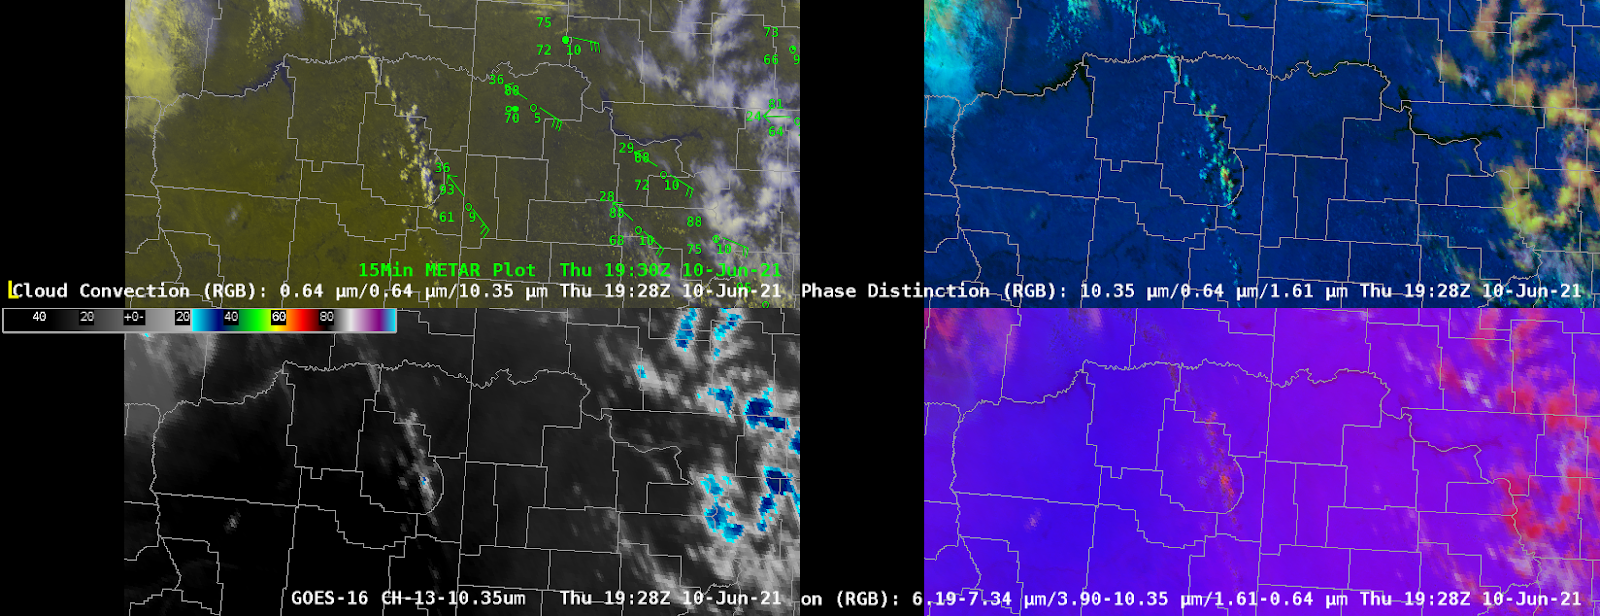
The image above shows updrafts getting stronger in the 10.3 micron imagery (bottom left), and on the Daytime Convection RGB (bottom right) by evidence of yellow (red +green) pixels. Inflow feeder bands, a flanking line, towering cumulus above an invigorating RFD or flanking towers, and above anvil cirrus plume are also observed in the Day Cloud Convection and Cloud Phase Distinction RGBs (top panels) indicative of the storms likely being severe. In fact, the ProbSevere v3 and v2 output both indicated a very high probability of severe weather occurring with these storms with values over 90% (purple colors).

Tall cell in western GGW’s area

Strong updraft in western GGW showed the red colors going over to greens…likely the updraft getting into the warmer stratosphere.

Day cloud phase distinction loop over the area shows a continued strong updraft with gravity waves radiating outward.

Quite a bit of flashes in that cell in GGW.

Charley

Stronger Core

Continuing the SVR downstream, as yet another strong core pops up.  Colder cloud on IR and now prob severe is starting to jump up.  Blue color showing ProbHail and ProbWind in the 30s.

Cell also showing more signs of organization in the SRM…better chances for hail.

Also getting a pickup from the DMD (latency issue still for NMDA).

Charley

Pocatello Storms

We’re currently monitoring conditions in eastern Idaho. Right now I’m using various applications to analyze and initialize current conditions. Currently AllSky is showing cape around 1000kj, and PWATS around .80 inches.

That PWAT value on the morning sounding just west of the area was close to .64″. Seeing how moisture levels are lower to west I can interpolate that the moisture values are similar to what’s show on allsky. The allsky 900-700mb also seems to pick up on the relatively moist area in the lower half of the atmosphere.

Looking downstream we’re noticing a line of developing convection using the Day land cloud RGB. It’s helpful to analyze just how high the tops of the storms are getting combined with cloud tops.

Zooming in closer I can examine the few storms that have popped up more closely. The RBG help the differentiate between the ambient cirrus clouds from the growing storms. That might not have been as easy to see using a typical visible view.

The AFA and Minimum flash area maximums are hinting at growing convection just downwind.  That growth leads to me to anticipate further intensification as these storms move into a more favorable environment in eastern Idaho.

As storms begin to intensify probsever eis picking up on the strongest activity. Probsevere began to ramp up for the cell just south pf Pocatella. That combined with traditional radar methods lead me to issues a warning for that cell.

A similar situation unfolded with a south just south of CWA that I debated on warning. The probsevere values did show and uptick. Eventually the storm fell apart as it pushed into southern Idaho.

We’re watching a few cells in the southern half of the viewing area.  As NUCAPS comes in I’m comparing it the allsky cape. The allsky cape is around 1100kj.

The modified sounding is putting out about 700kj of ml cape. While the nonmodified is much lower down to 500kj.

We don’t have a midday sounding to see which one is initializing the best. For what it’s worth. The rap cape output is around 500kj.

The TPW was close to the observed pwats as well. It was outputting about .65″.

The FED has been fairly low this afternoon which isn’t typical for what I have been usually see. However, the AFA and the MFA are higher indicative of growing updrafts. I’m thinking the FED might be lower because of potential hail in the updraft.

The cell pushing out of Freemont county Idaho continues to intensify as it pushed into Montana. Both the MD, and NMDA were picking up on a high meso that was clearly seen on SRM.


The CPTI was showing high probabilities as well.  I still wasn’t as concerned about a tornado threat due to how high the base of the storm was. It was interesting to see though.

The forecast cape and cin values came in from the NUCAPS,  but it wasn’t usable for my area because their was a lot of missing data.

The actual Pocatella office issued a warning for Freemont county. Using typical radar methods the storm didn’t look like it warranted a severe thunderstorm warning, but satellite and MFA showed new convection was still firing up. Right after looking at satellite there was a report of a 54mph wind gusts.


ProbTor Spikes to 72%, But is it Legit?

A semi-discrete cell tracked NNE of Little Rock, Arkansas. This storm developed a very tight reflectivity gradient on its southeast flank.  A few other notable features were an inflow notch and hook-like appendage.  Mitigating the severe potential with this storm was an outflow boundary displaced to the east of the updraft and low cloud flash counts (ground based) or cloud extent flash density (GLM).

The 0-2 km azimuthal shear generated what seemed to be a spurious bullseyes south of Searcy, Arkansas with values over 0.020 S-1. This data was input into the ProbTor algorithm, causing the spike to 72%.  The 0-2 km azimuthal shear derived with the new dealiasing technique never plotted values over 0.008 S-1. In fact, the bullseyes which were located slightly to the NW of the primary rotation track, never showed up in the new azimuthal shear product. -Roy


Merged Advanced TPW Too Low in Cloudy Areas this Afternoon

The Merged Advanced TPW is underdoing PWAT values in cloudy areas over central Oklahoma. There are discontinuities where it goes from clear to cloudy skies.

The 18z KOUN RAOB sampled 1.52″ PWATs, while the Advanced TPW is showing only around 1.00″.

Meanwhile, the All Sky LAP PWAT appears to be better representing reality, with PWATs around 1.70″

Ron Dayne

Using All-Sky LAP to Identify Areas of Destabilization

Rapid destabilization is occurring over portions of northwest Texas and southwest Oklahoma. This can be seen in the all-sky LAP CAPE product:

Looking at a four-panel image of all-sky LAP precipitable water for the entire layer, as well as the surface to 0.9 sigma, 0.9-0.7 sigma, and 0.7-0.3 sigma levels, we can see why this is the case. The top-right image shows low-level moistening in the surface to 0.9 sigma layer, which is confirmed by surface observations showing dewpoints rising from the low-60s to the low-70s over the course of 6 hours. Meanwhile, the bottom right image shows midlevel drying associated with steeper midlevel lapse rates advecting into the region.

Ron Dayne

Using All Sky CAPE to identify warm front and dry line

Just getting to look at the potentially very volatile day here in central OK, so wanted to start be looking at the All Sky CAPE to help identify the movement of two critical boundaries, a warm front moving northward, and the dry line moving eastward. This loop very nicely shows the advancement of the two boundaries over the last couple of hours, with a surge of CAPE moving into the southern half of Oklahoma. Observations are overlayed on the clear sky CAPE for verification. Useful product for SA today.

Thorcaster