ProbTor Spikes to 72%, But is it Legit?

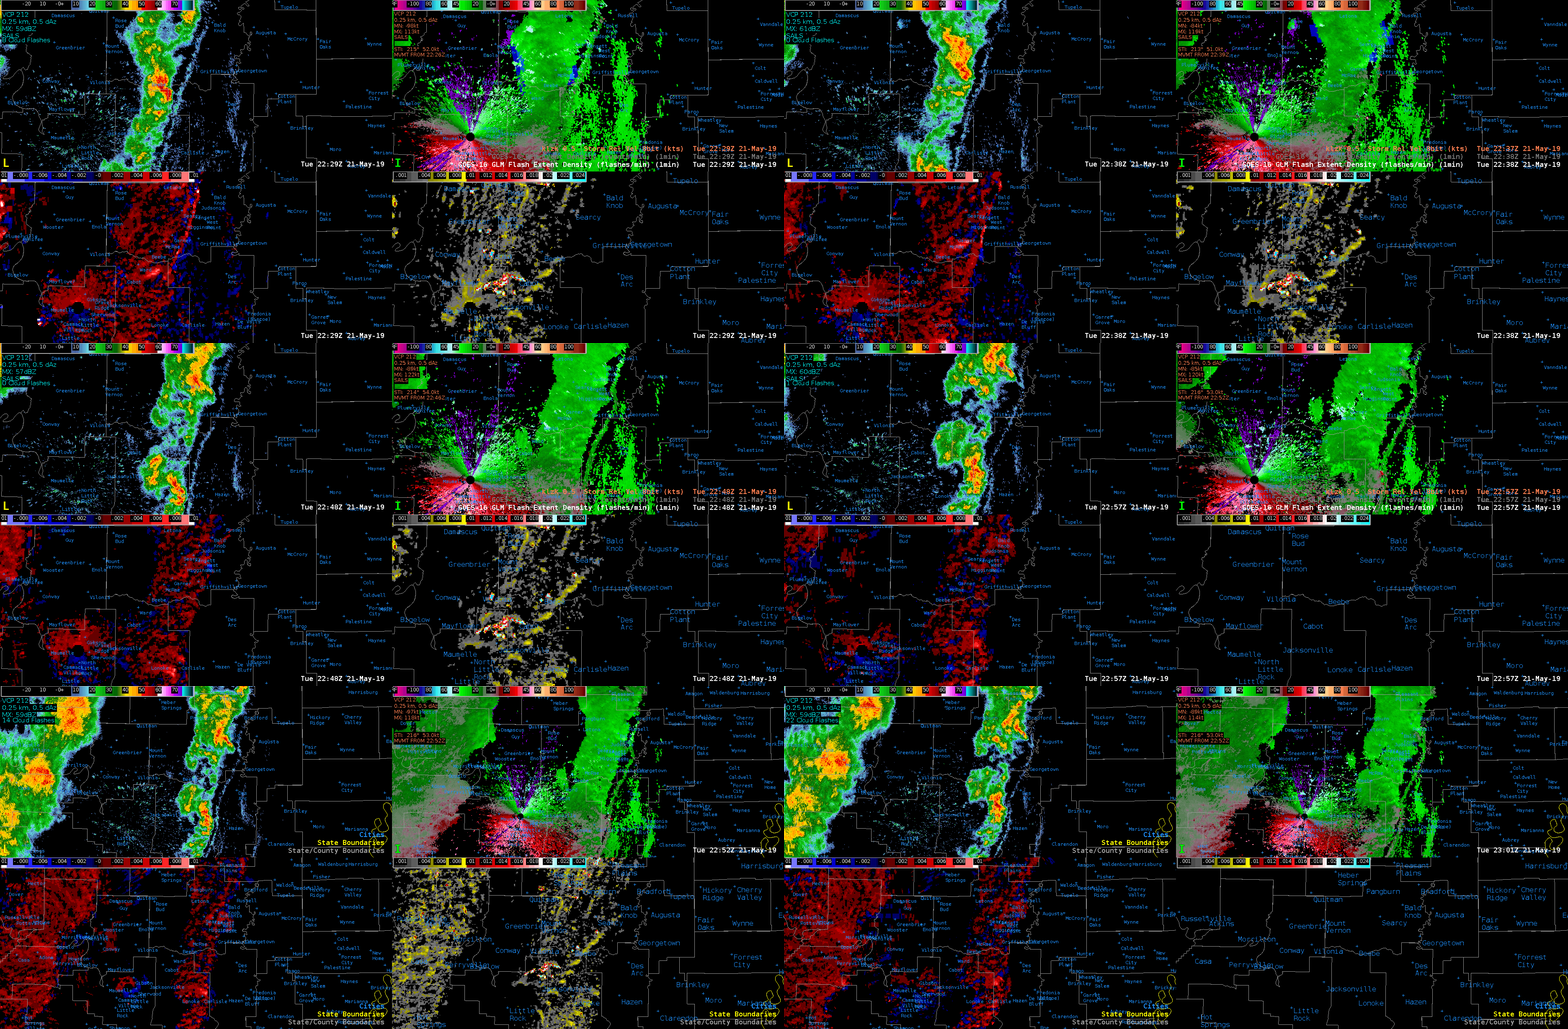
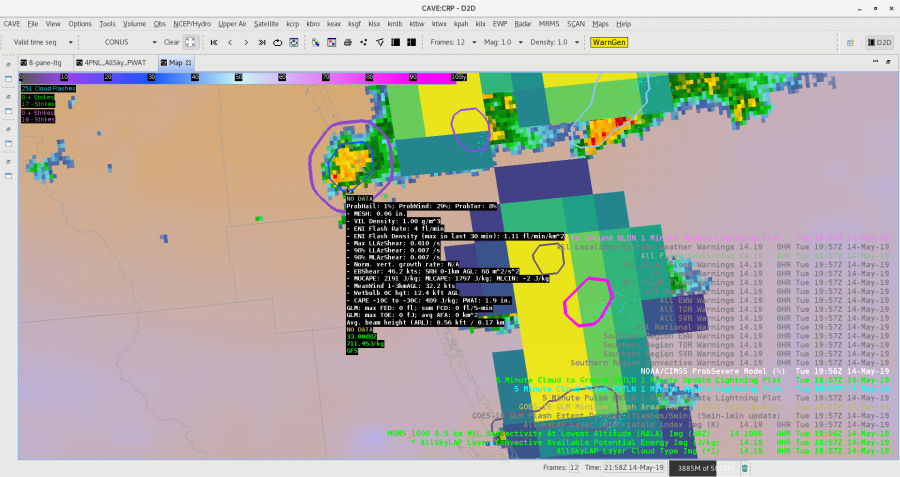
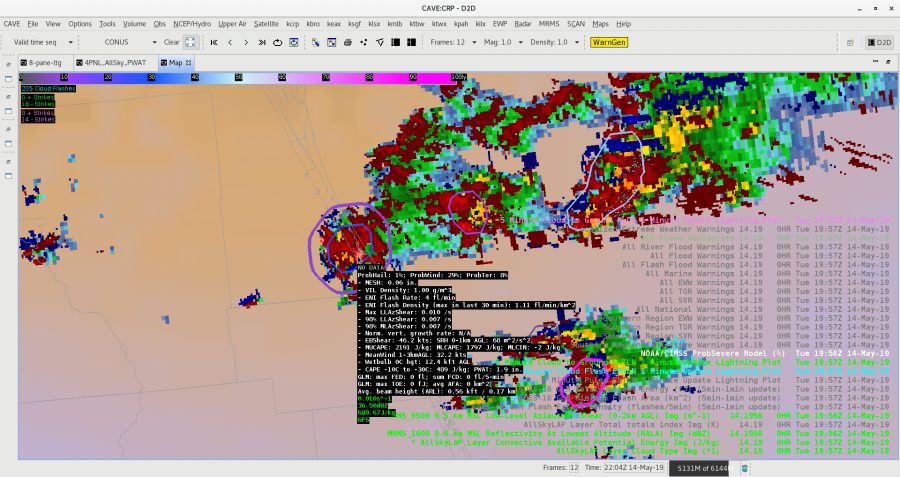
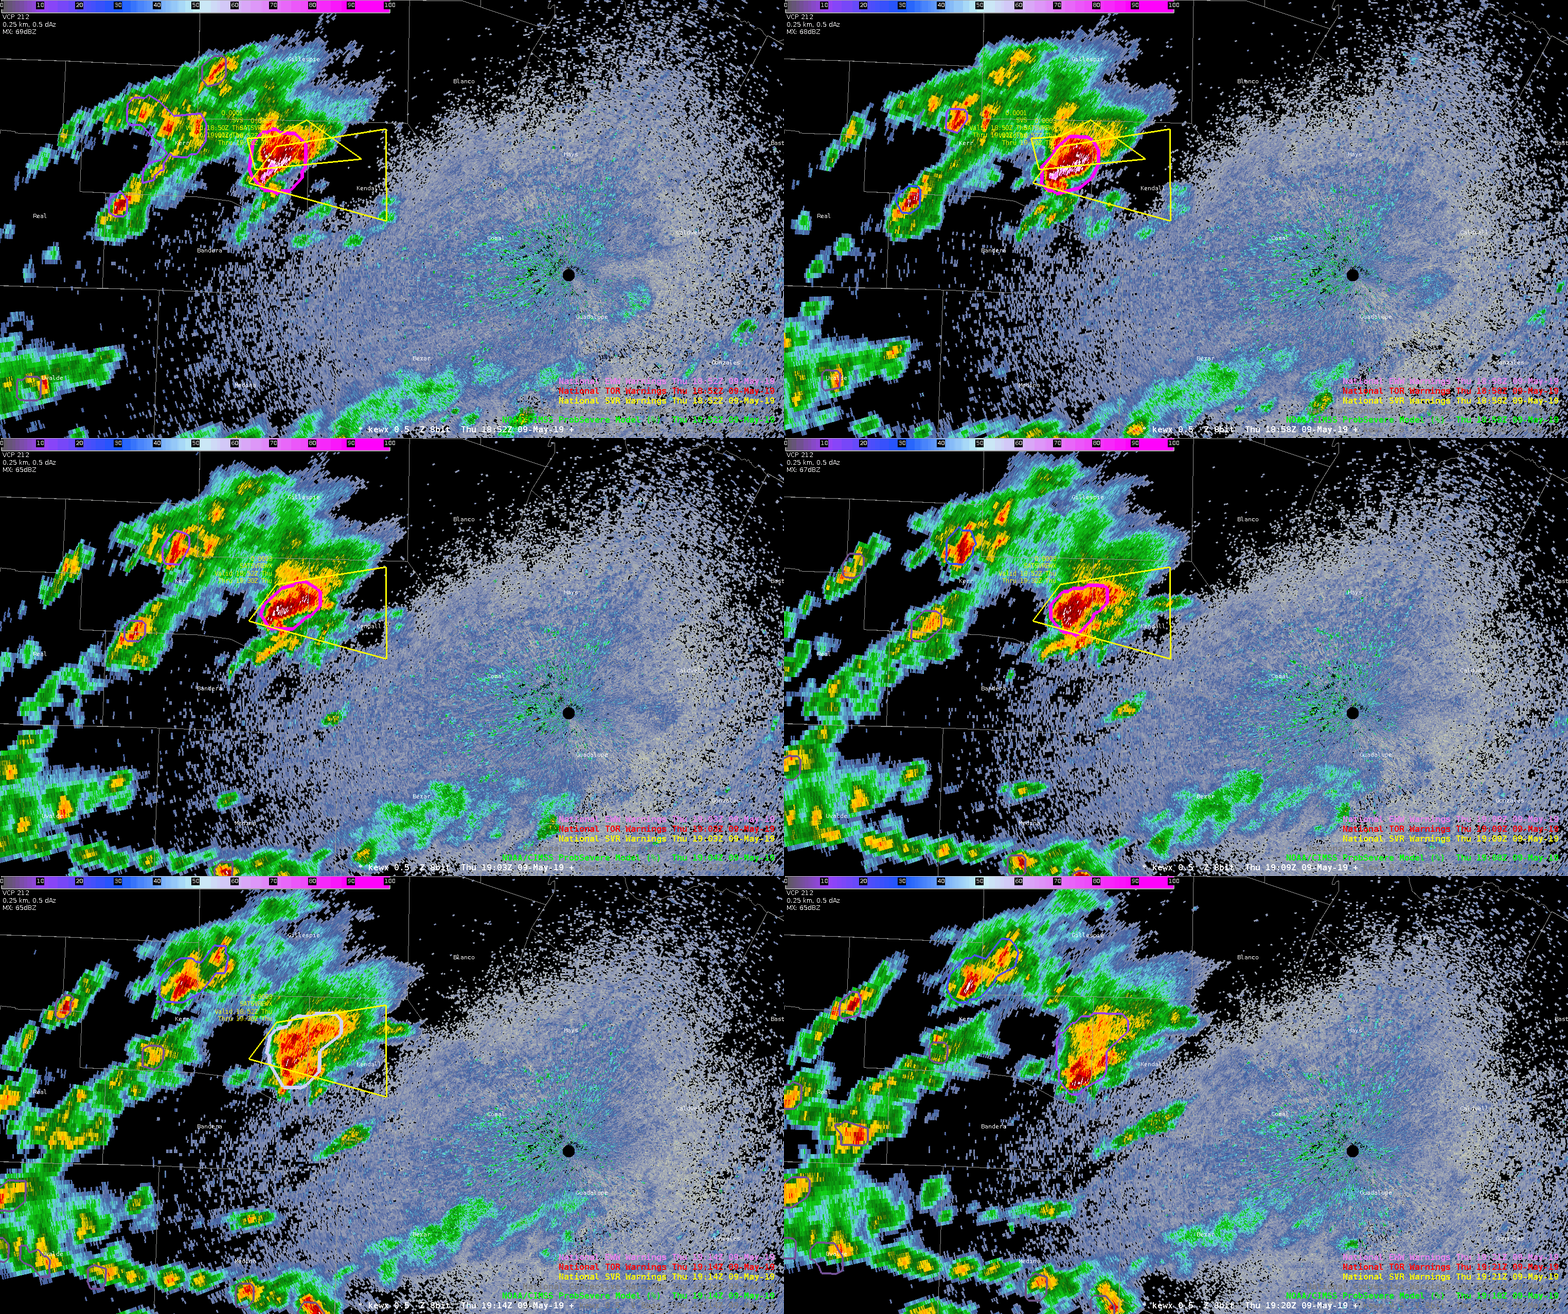
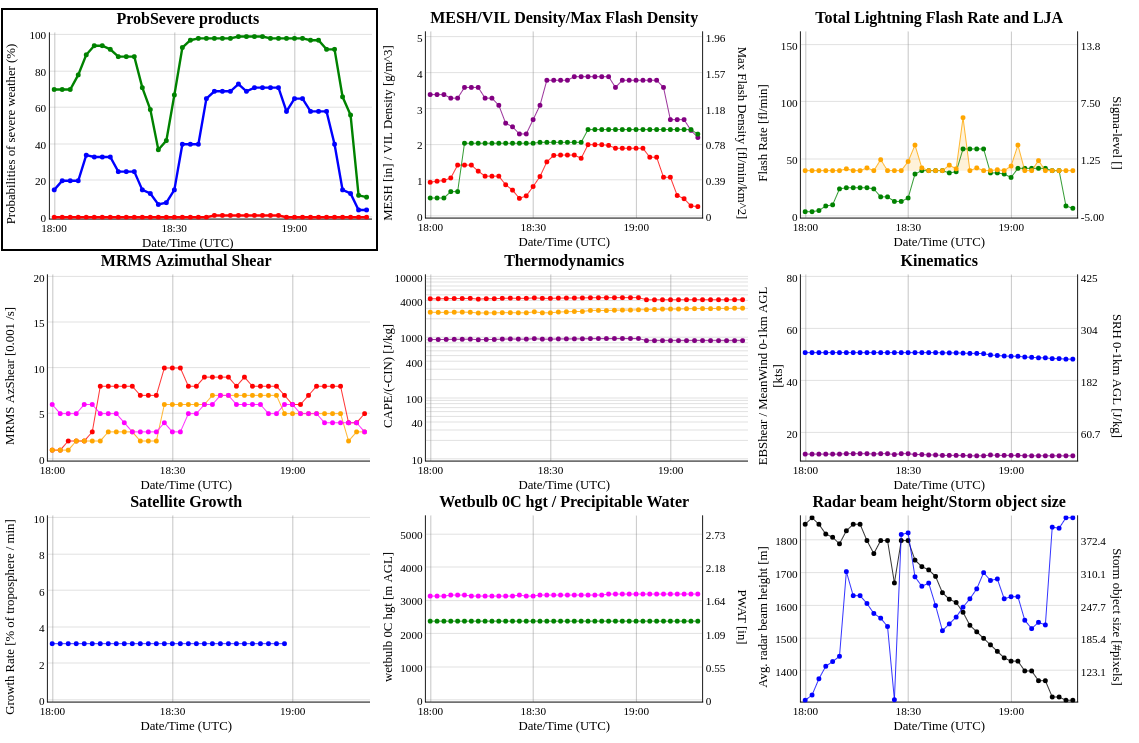
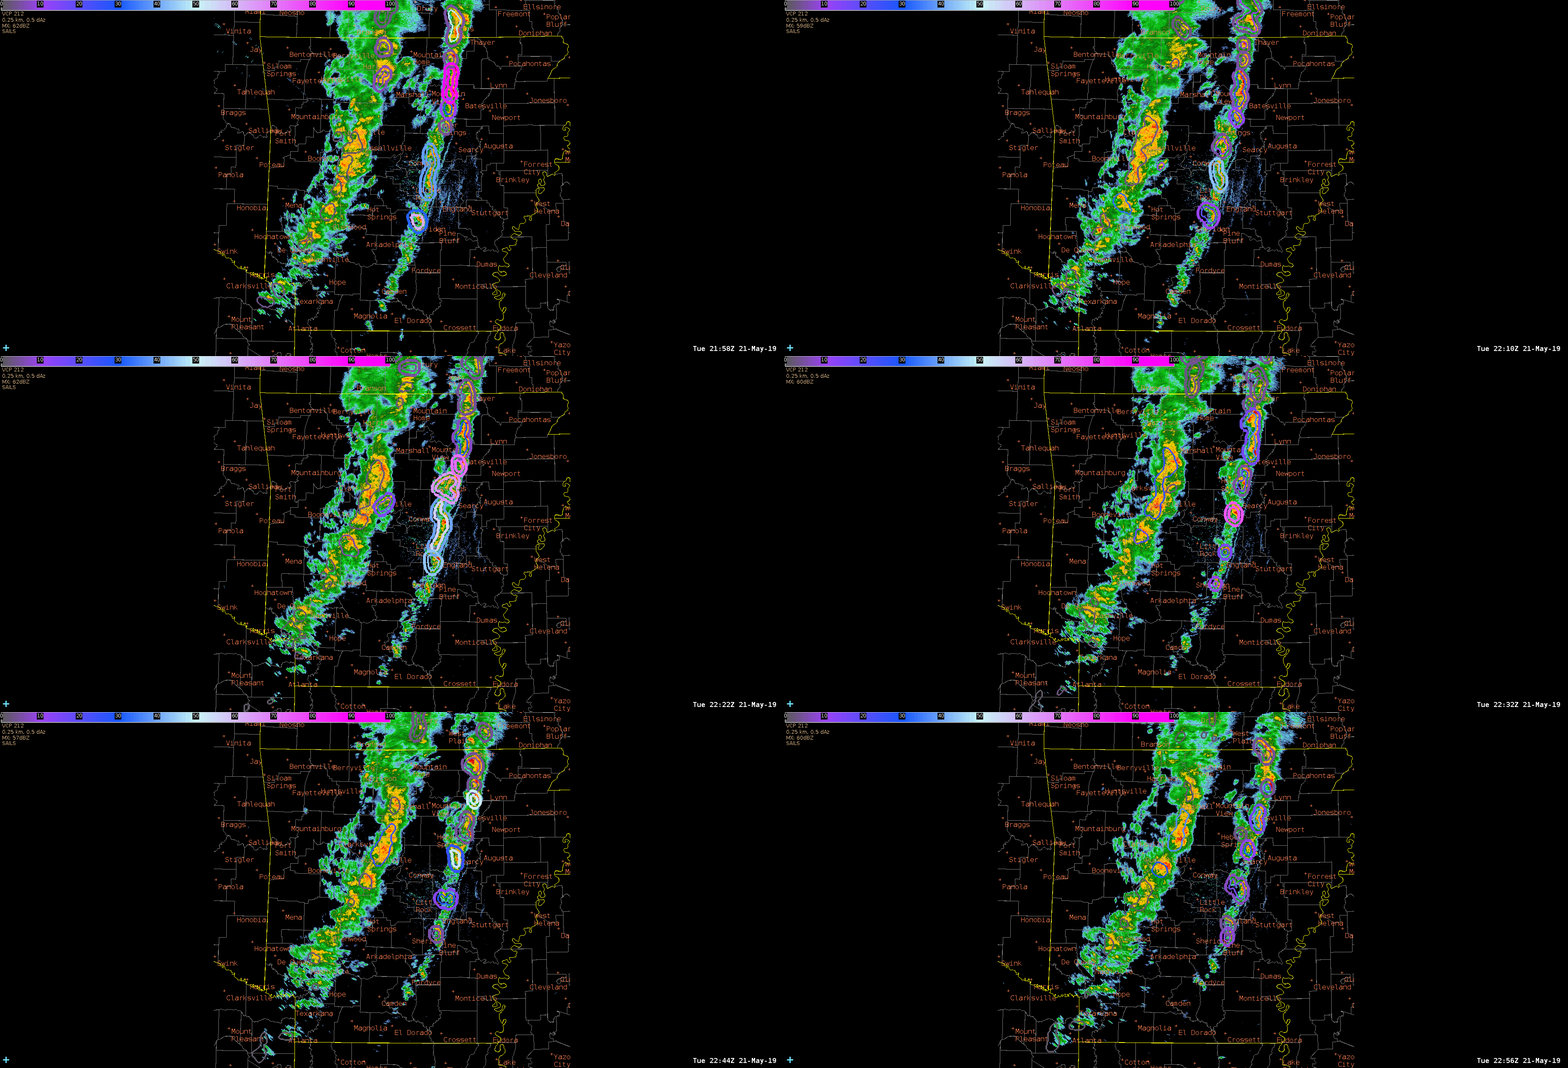
A semi-discrete cell tracked NNE of Little Rock, Arkansas. This storm developed a very tight reflectivity gradient on its southeast flank.  A few other notable features were an inflow notch and hook-like appendage.  Mitigating the severe potential with this storm was an outflow boundary displaced to the east of the updraft and low cloud flash counts (ground based) or cloud extent flash density (GLM).

The 0-2 km azimuthal shear generated what seemed to be a spurious bullseyes south of Searcy, Arkansas with values over 0.020 S-1. This data was input into the ProbTor algorithm, causing the spike to 72%.  The 0-2 km azimuthal shear derived with the new dealiasing technique never plotted values over 0.008 S-1. In fact, the bullseyes which were located slightly to the NW of the primary rotation track, never showed up in the new azimuthal shear product. -Roy


GLM usability in heavily parallaxed locations

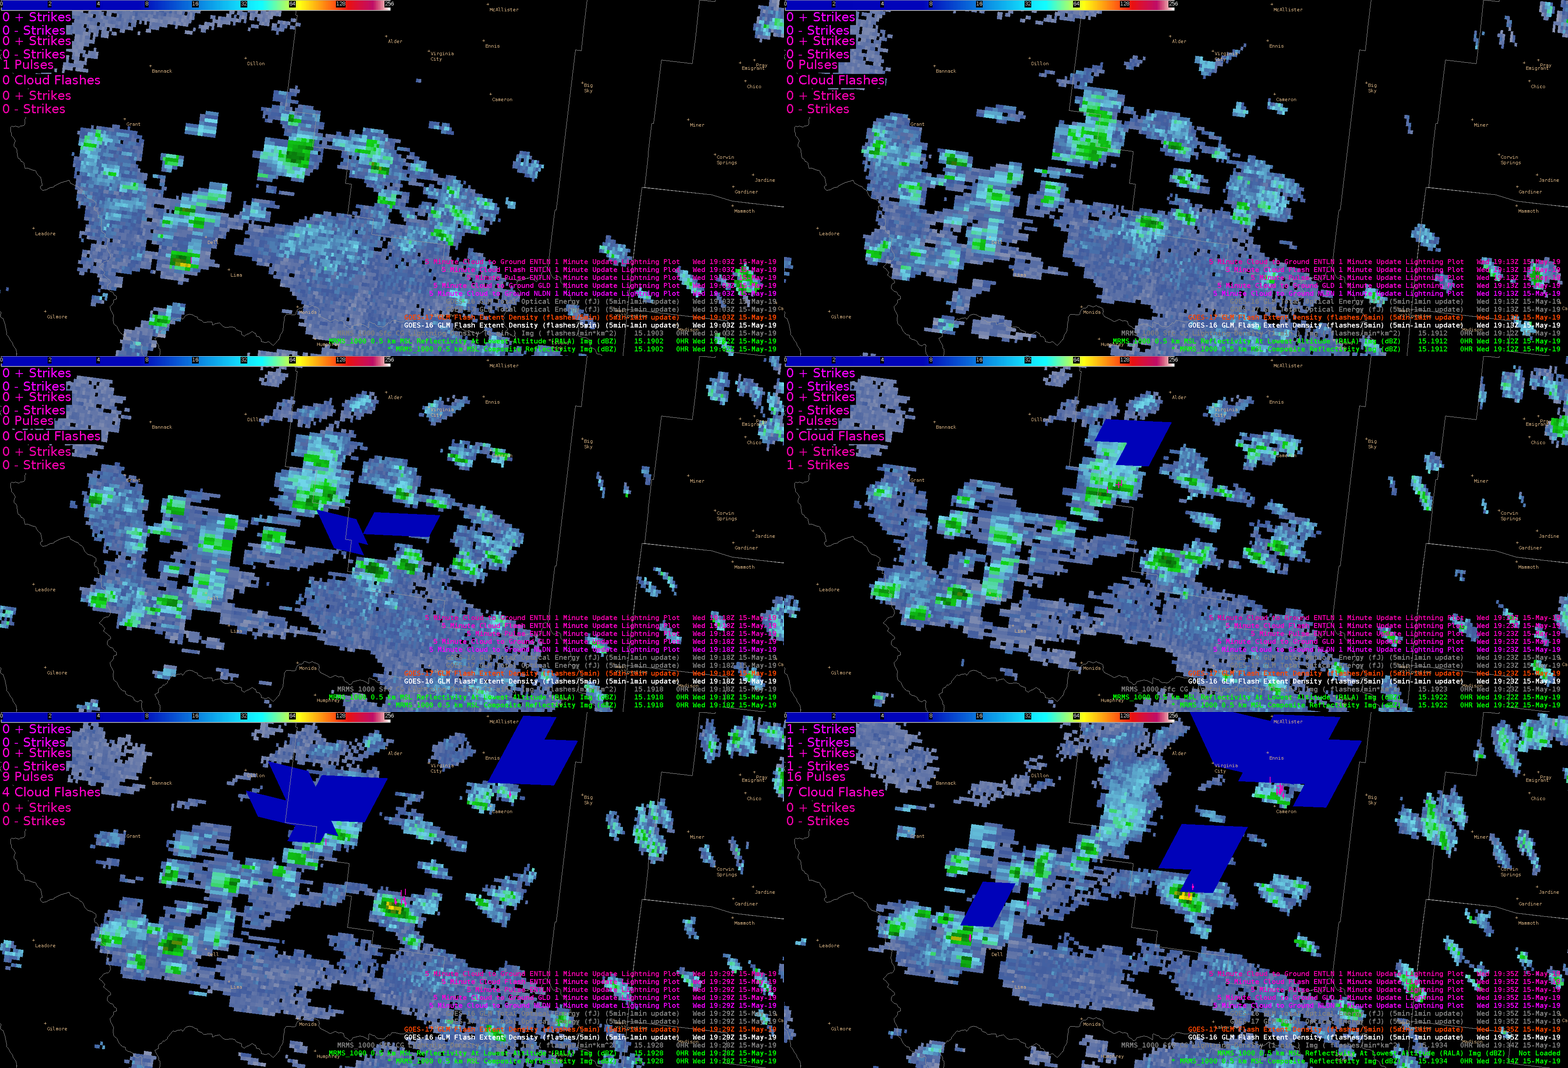
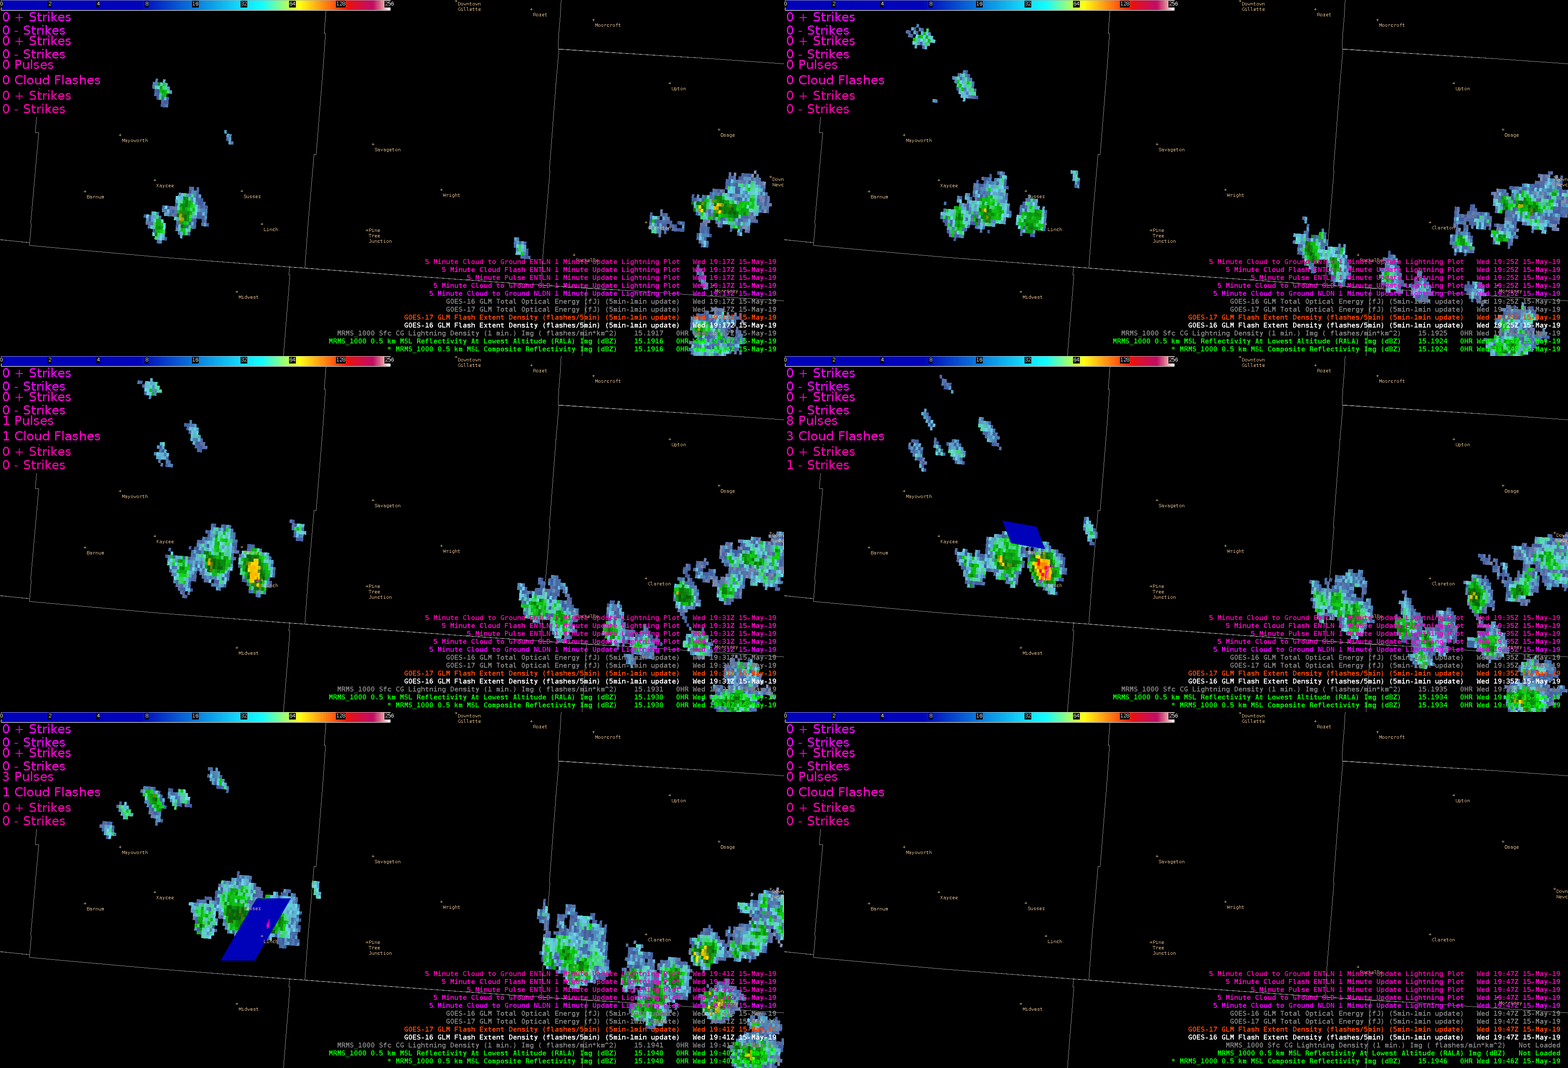
It’s pretty clear to me that both the GOES-west and GOES-east are having a lot of trouble detecting lightning (GLM) in the northwest U.S. with accuracy of location or frequency due to parallax, spatial resolution, and GOES tilt sampling of storms. Below is an animation specifically over southwest Montana where the GLM displaces the FED significantly (side note: TOE was very similar for these, so FED is shown for best example), and also has trouble picking up in-cloud pulses. The ENTI is overlaid in pink to show the differences in GLM vs ENTI. If you watch closely, the first frame depicts an ENTI in-cloud lightning flash & pulse in the far southwest portion of the screen, where no GLM FED (or TOE; not shown here) was even detected. There is also some instances where the GLM places lightning pixels where the ENTI or NLDN does not show anything in the same time frame (also making it hard to verify both products).
 

Below is a separate example where the FED does not show what I would expect it to show for a central Wyoming storm (differentiating intensity as well as location and timing). The GOES-east is the first to detect, then the GOES-west detects thereafter. GOES-east and GOES-west did not detect at the same time in any frame. Both products are loaded as a 5min-1min update.
 

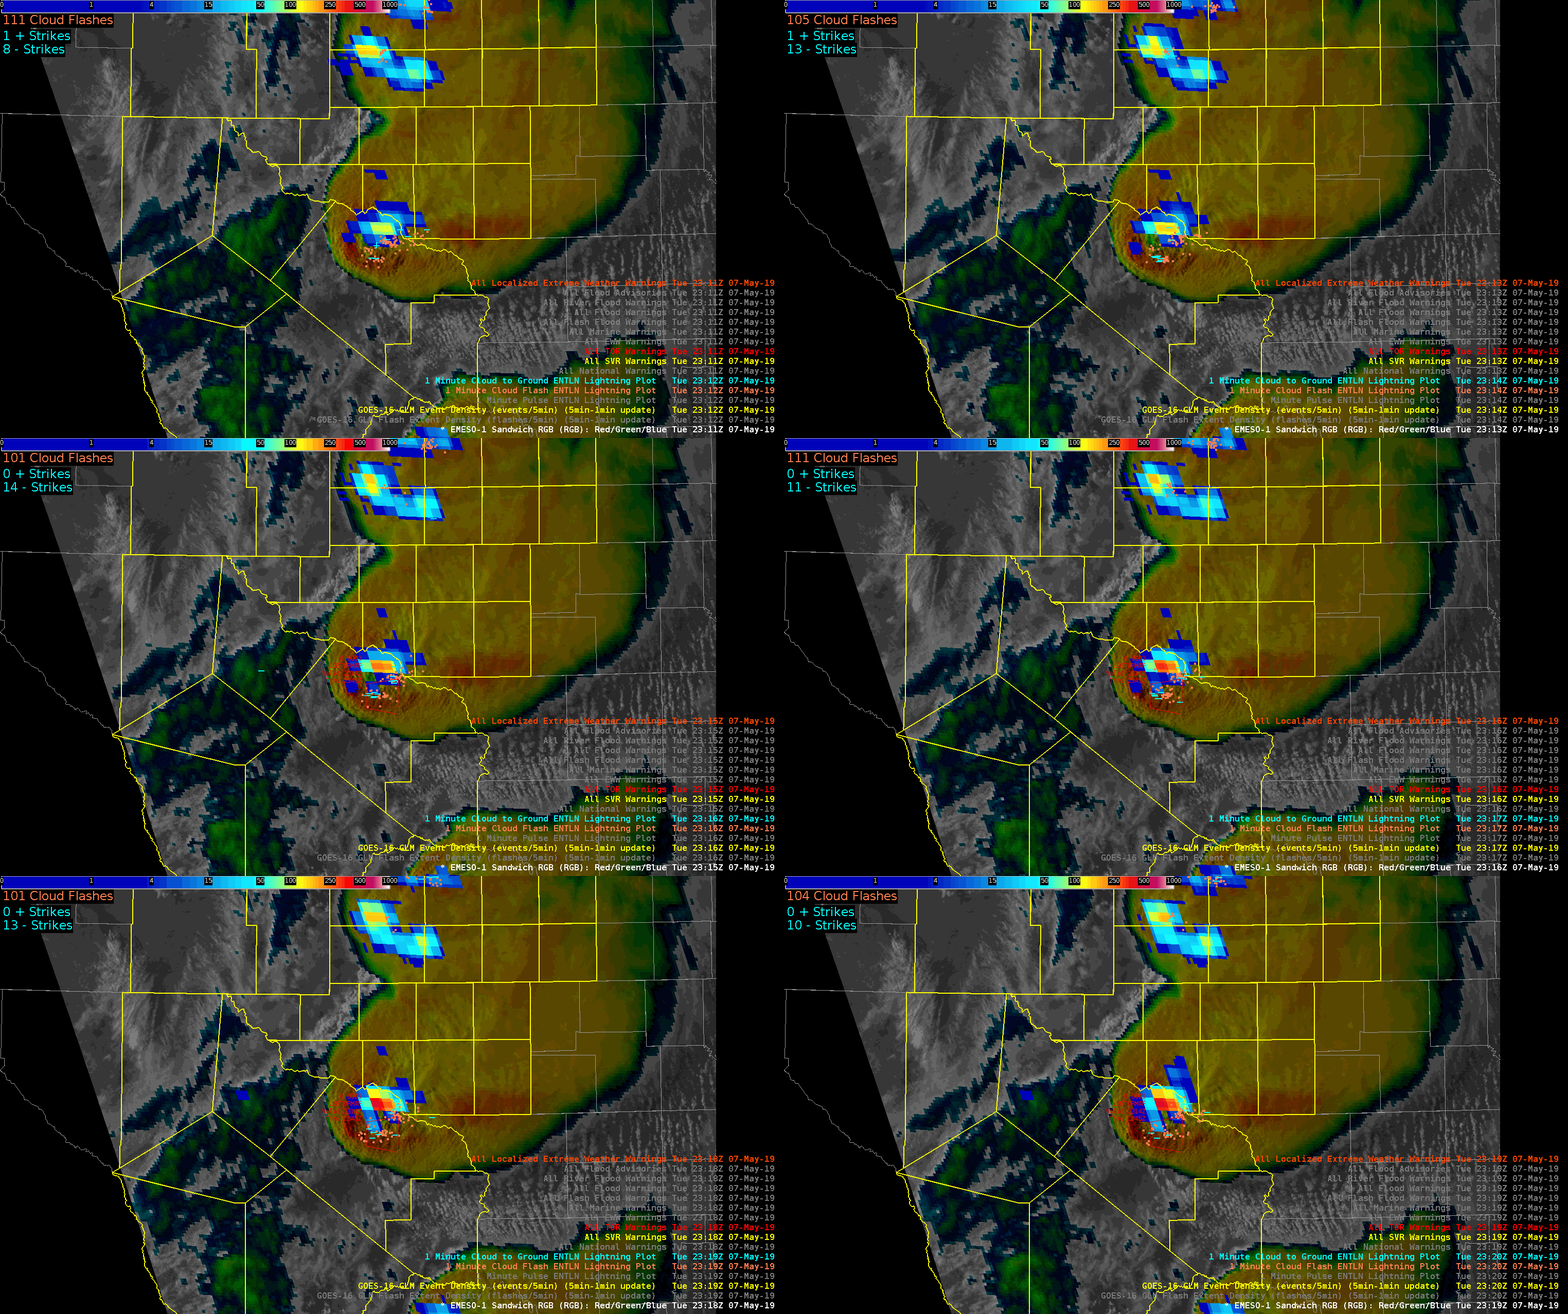
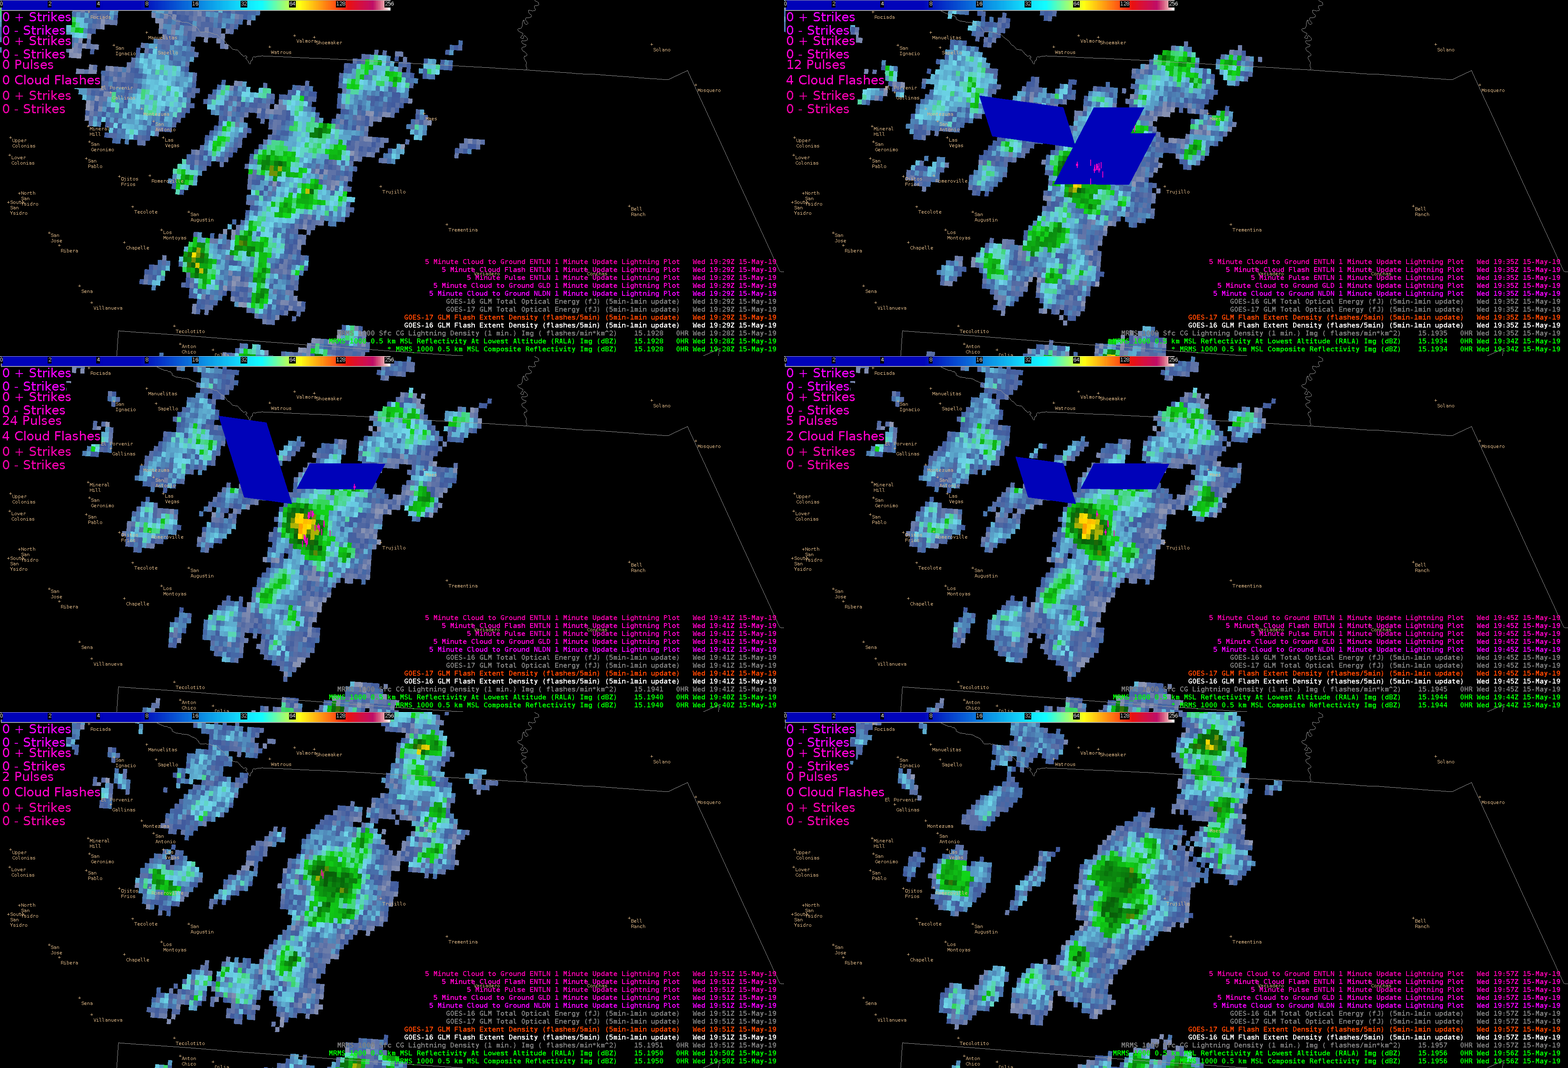
Now here’s a case farther south in New Mexico where a storm cell is of comparable intensity as the northern examples. The GLM detection seems more accurate than the MT case, but the last frames here show that the GLM also has trouble with keeping FED on the cell core of interest.
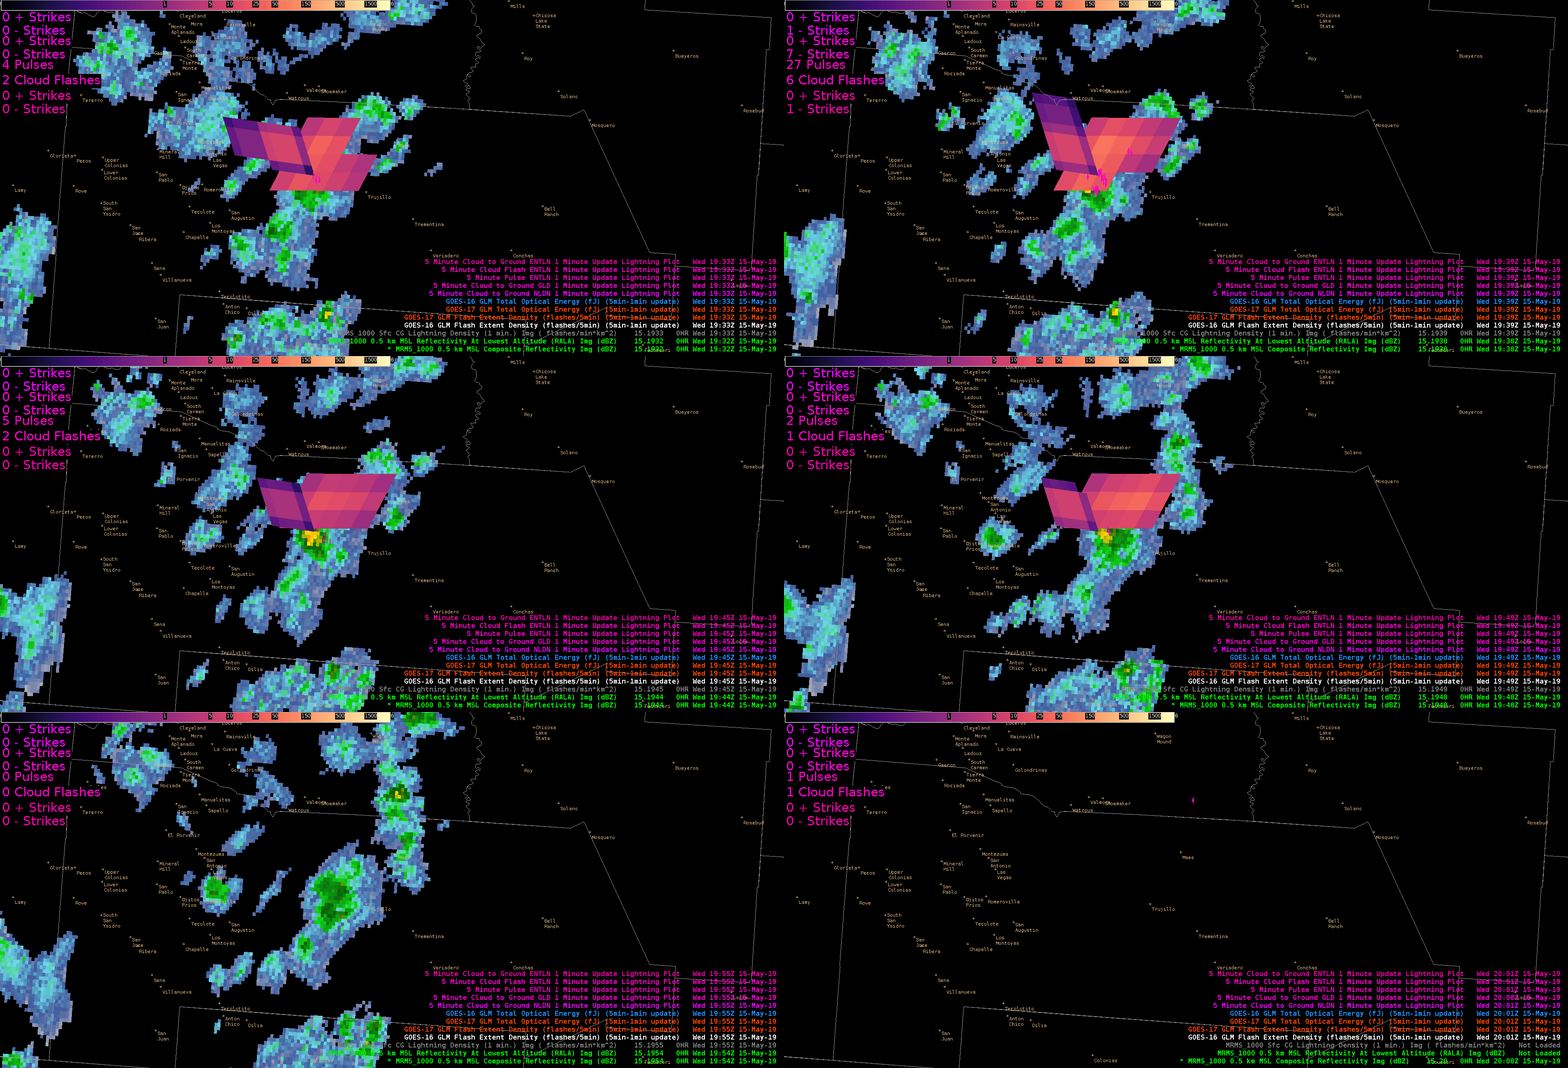
Interestingly enough, the TOE (shown below) does a better job here  in NM with spatial coverage than it did up north in MT, but still has displacement issues comparing to ENTI and MRMS storm cores. I find that the TOE (especially with GOES-west) does a better job at recognizing the spatial extent of a flash here than the FED product did. (See above vs. below).
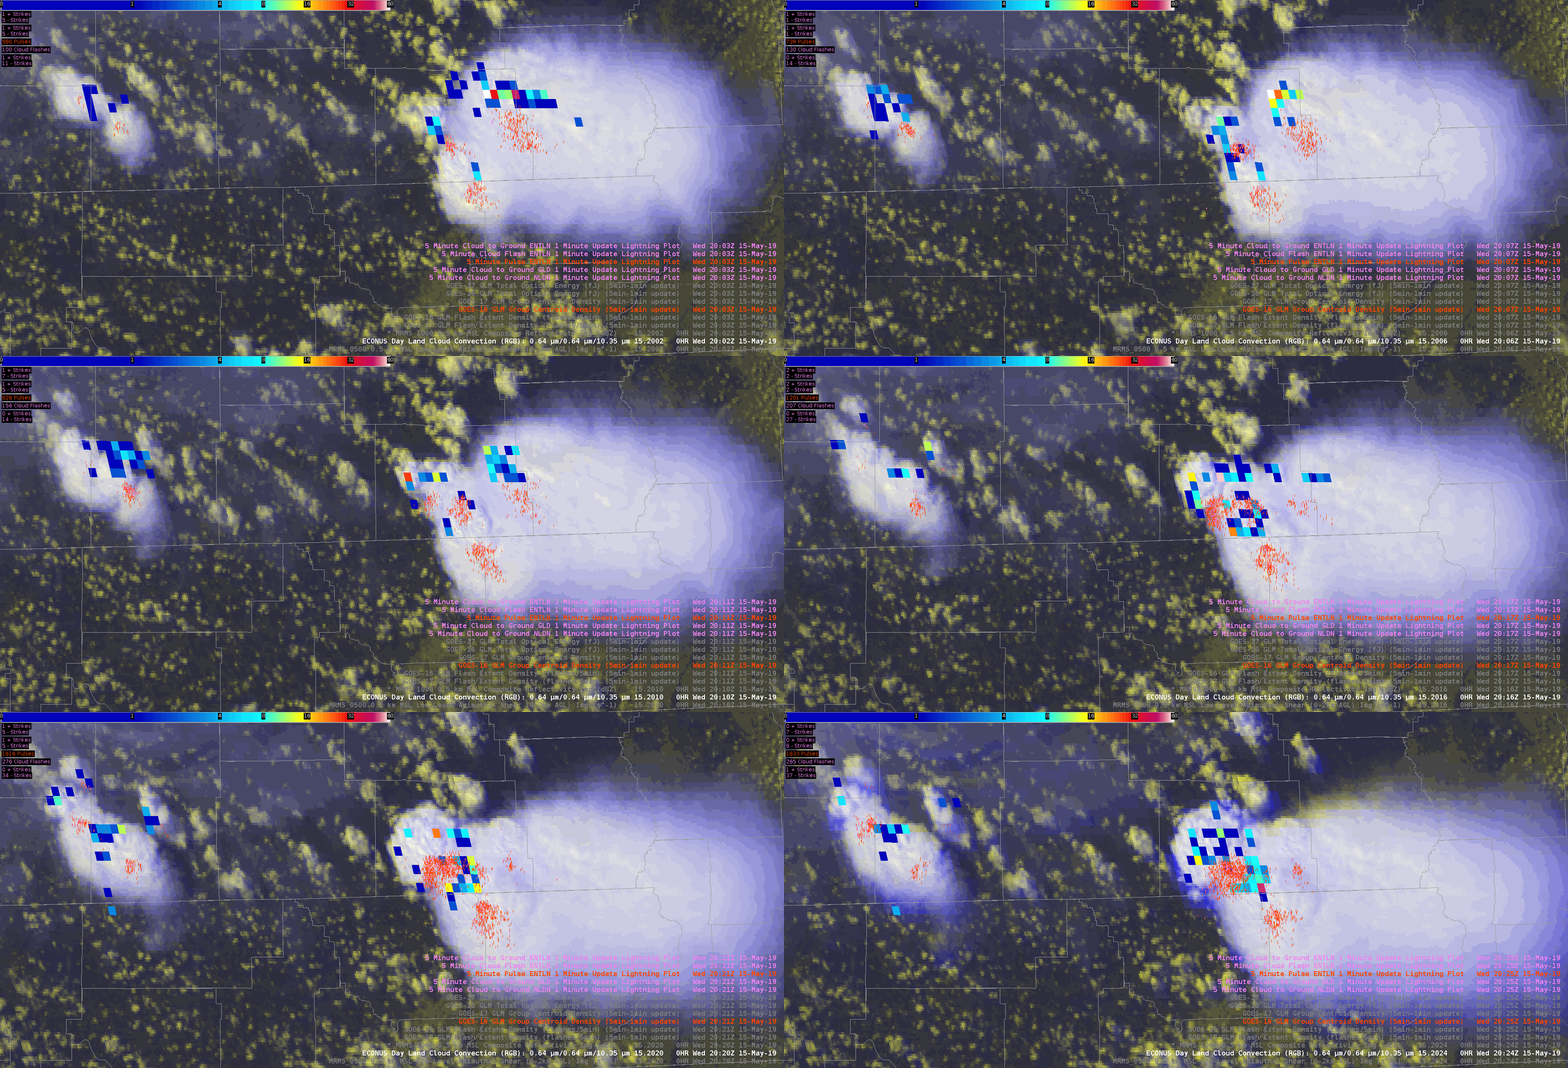
Now the question is, is the parallex better in the south-central U.S.?  And what if we look at higher resolution products like the group centroid density GLM product? While comparing the satellite GLM, with Day-Land-Cloud-Convection RGB, and with the ENTI/GLD/NLDN strikes (overlaid in pink) in SE Missouri…..it’s clear that a forecaster should not solely rely on GLM for core lightning locations (below). -shearluck
Reiterating the use of GLM over open water

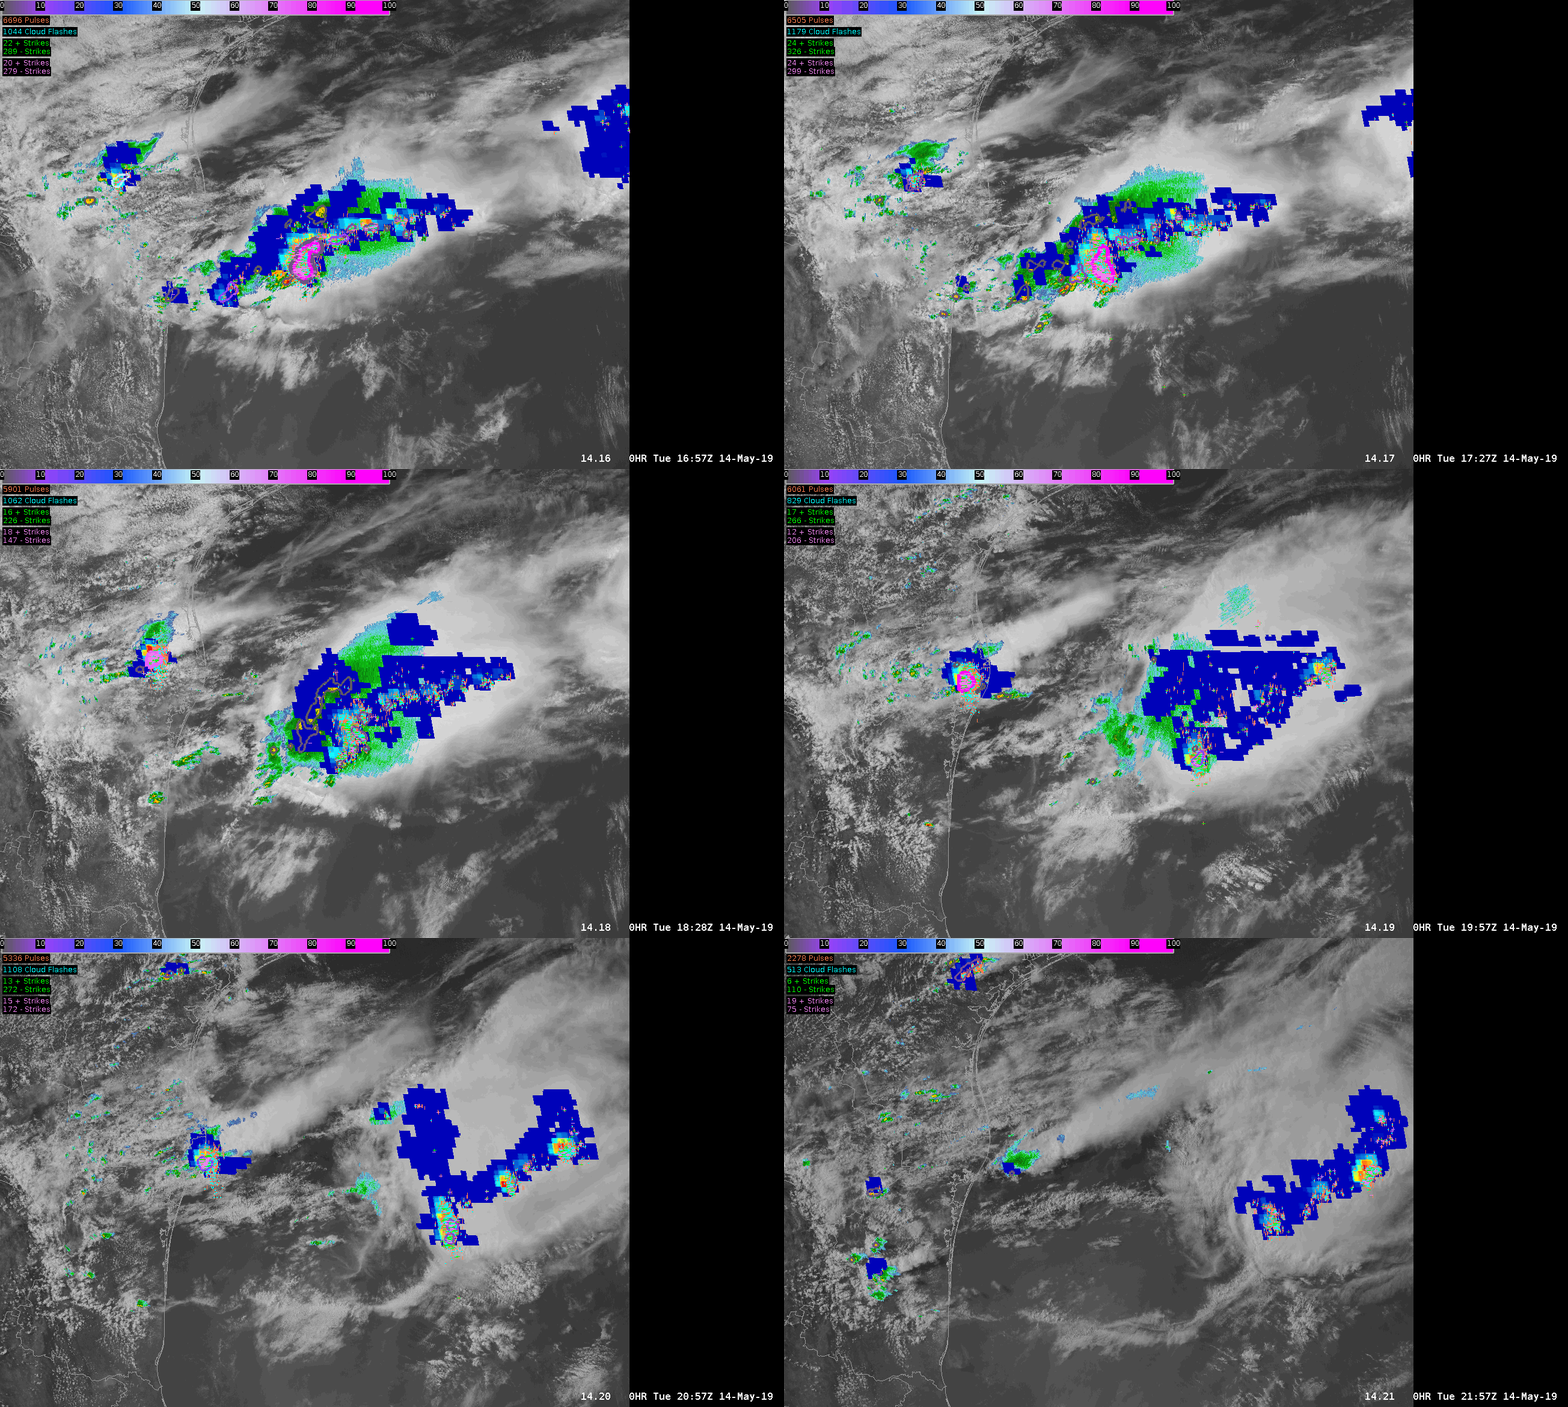
A great example of GLM usability is over the Gulf of Mexico (or any open bodies of water) where radar coverage and ENTI lightning sources diminish. Here’s an example of how a system moves eastward over the Gulf: radar disappears, but GLM (and some NLDN/ENTI) lightning data still lets you know where the strongest storm updrafts are located. Not only that, but the spatial extent of lightning is better known now that you have GLM alone. Below is displaying radar and satellite with FED GLM data, and NLDN/ENTI lightning detection. ProbSevere also becomes less relevant. The separate updrafts are easily distinguishable toward the end of the animation using FED.

Next animation is the same, but with FED on top of radar making it easier to see its evolution and usability:


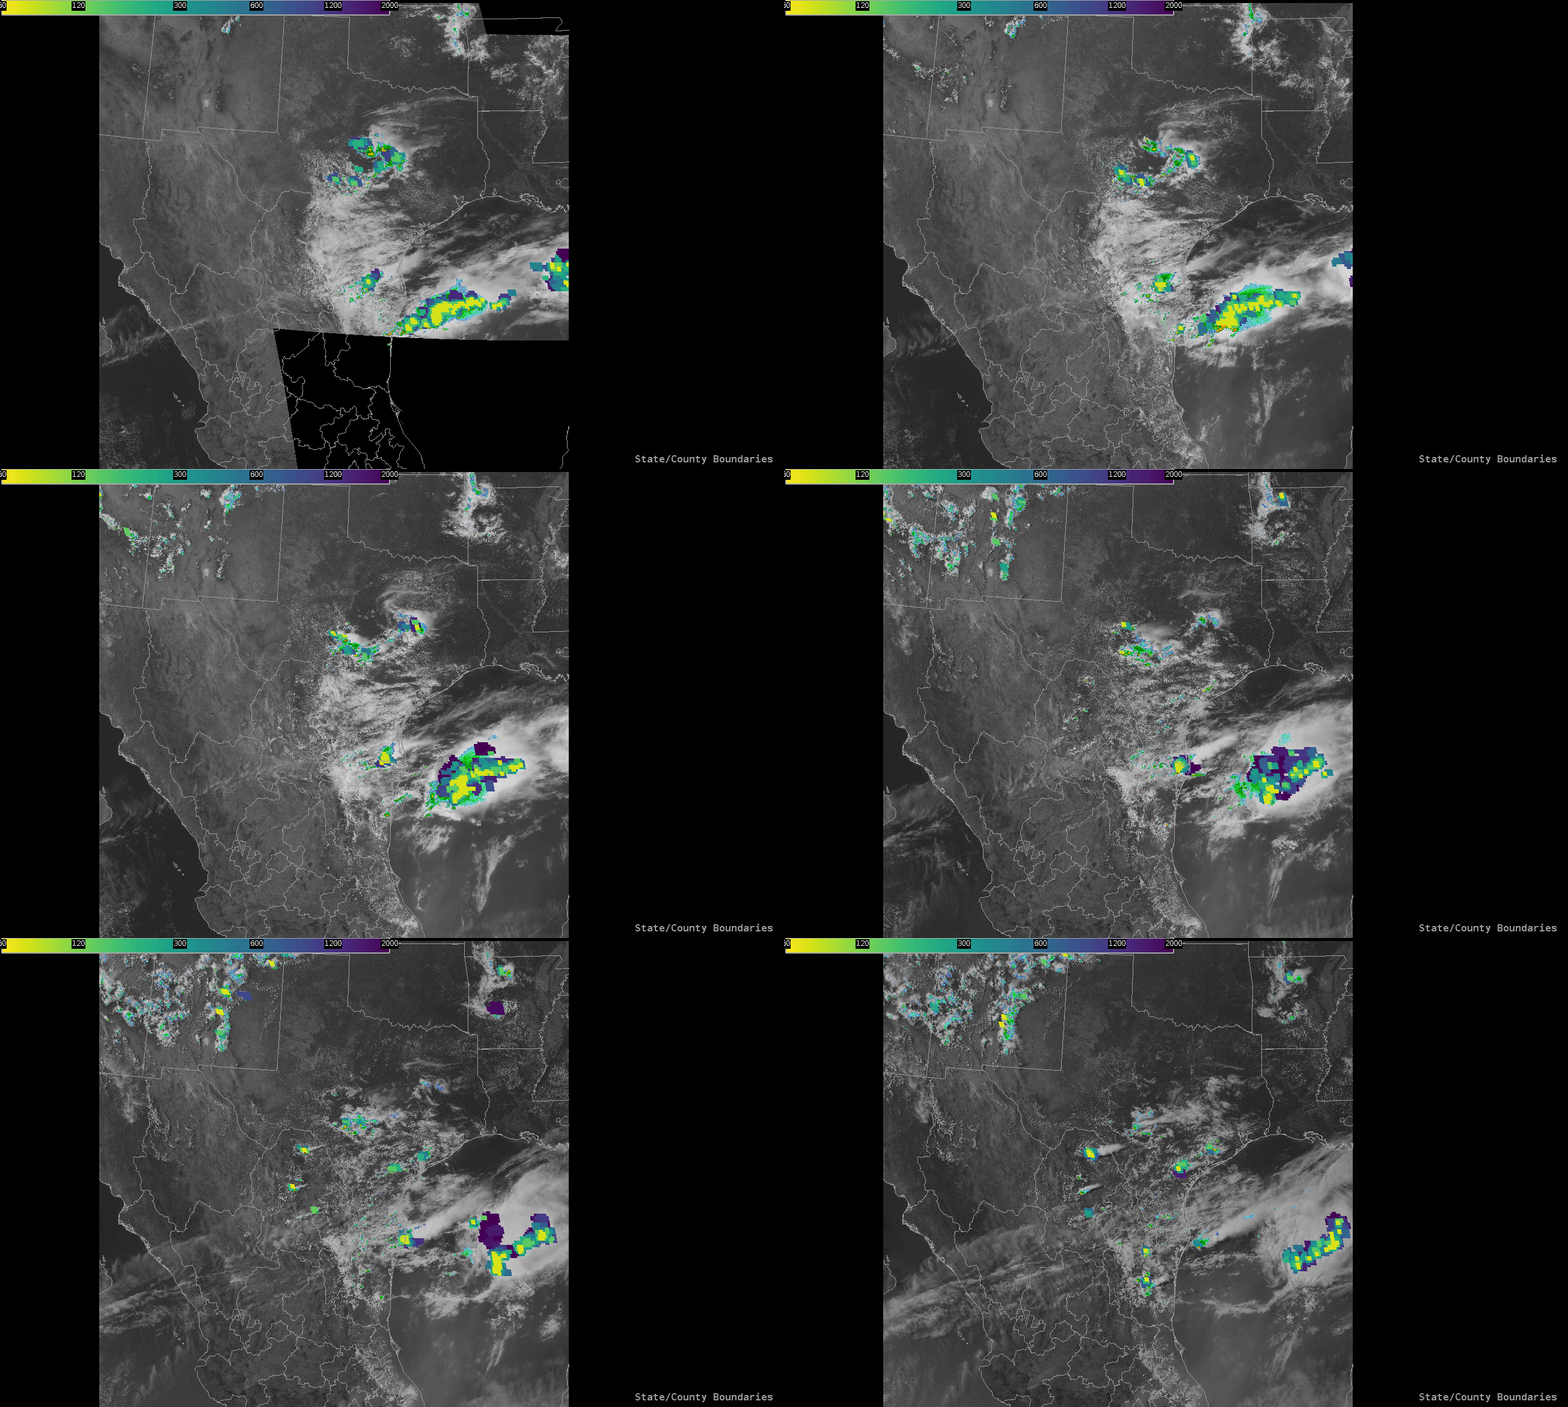
Now with the same scenario, comparing the Minimum Flash Area (MFA) GLM product with the Average Flash Area (AFA) GLM product, it is MUCH easier to differentiate new convection with the MFA product. Notice all of the yellow spots in NM and Mexico that make it easily detectable with the human eye as you watch your SA monitor. This may be a product of color scale for the AFA, but this tells me that the MFA would be more useful in convective initiation. I have not gotten much value out of the AFA  as I would with just simply using the FED (Flash Extend Density GLM product) or TOE (Total Optical Energy). -shearluck

TOP IMAGE: MFA       ;     BOTTOM IMAGE: AFA

ProbTor reliable? Lightning says no, MRMS says maybe.

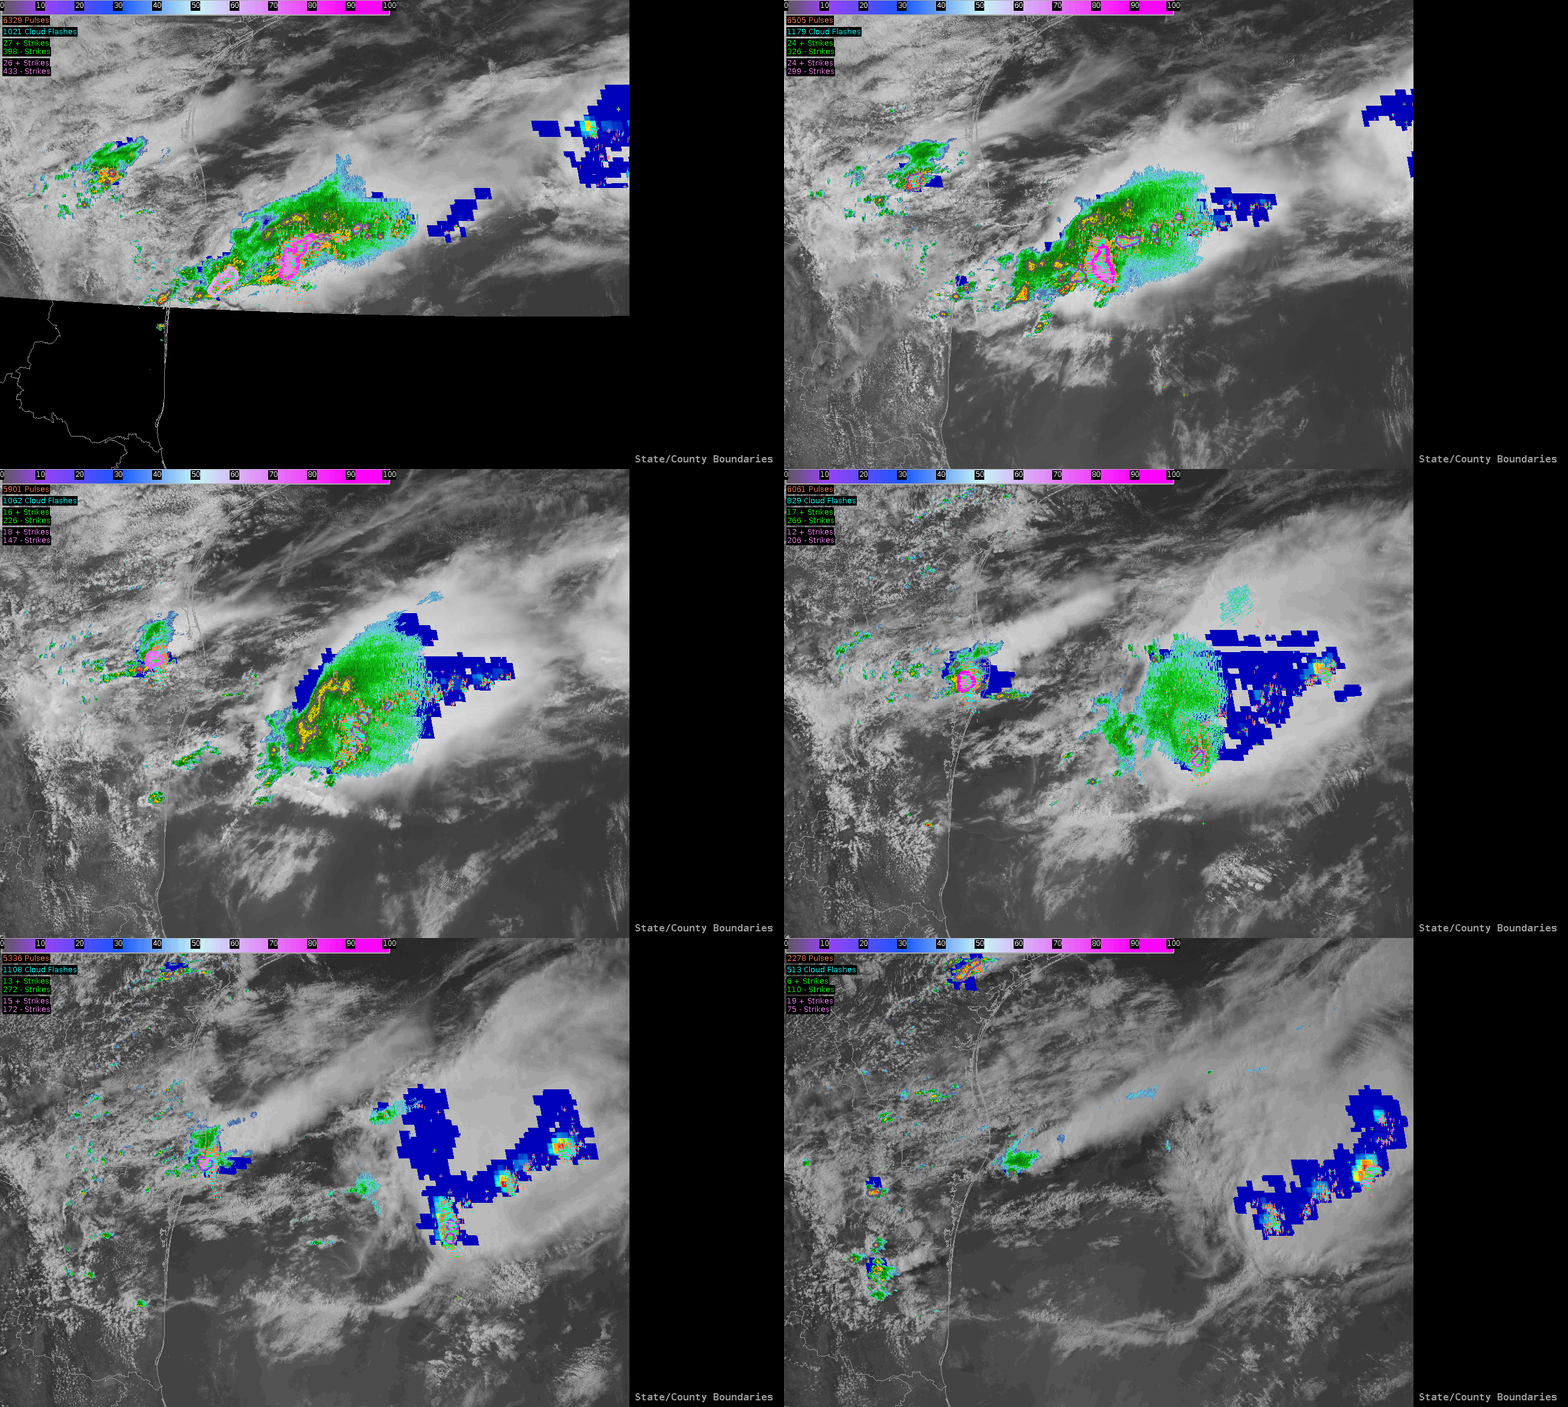
There is difficulty with having confidence of the ProbTor portion of the ProbSevere product due to an instance where it is estimating higher tor rates (8%) when a storm has no identified lightning (GLM, NLDN, and ENTI) along the coast of Florida. To be fair, the storm previously did indicate some lightning with it. I investigated the TOE, FED, and Min Flash Area in the vicinity of this storm, as well as usual point lightning data in 5 and 1 min updating intervals, and it has me confused as to what the ProbSevere is “seeing” for its lightning data (it is indicating ENTI lightning within its circle). Below is the image example of ProbSevere loaded alongside lightning data including GLM’s Min Flash Area:


I also pulled up the lowest level rotation tracks from MRMS data, and it did indicate a slightly higher maximum within the ProbTor circle, so I believe the ProbTor is locking on to that feature.   – shearluck


Life and Death in One Loop

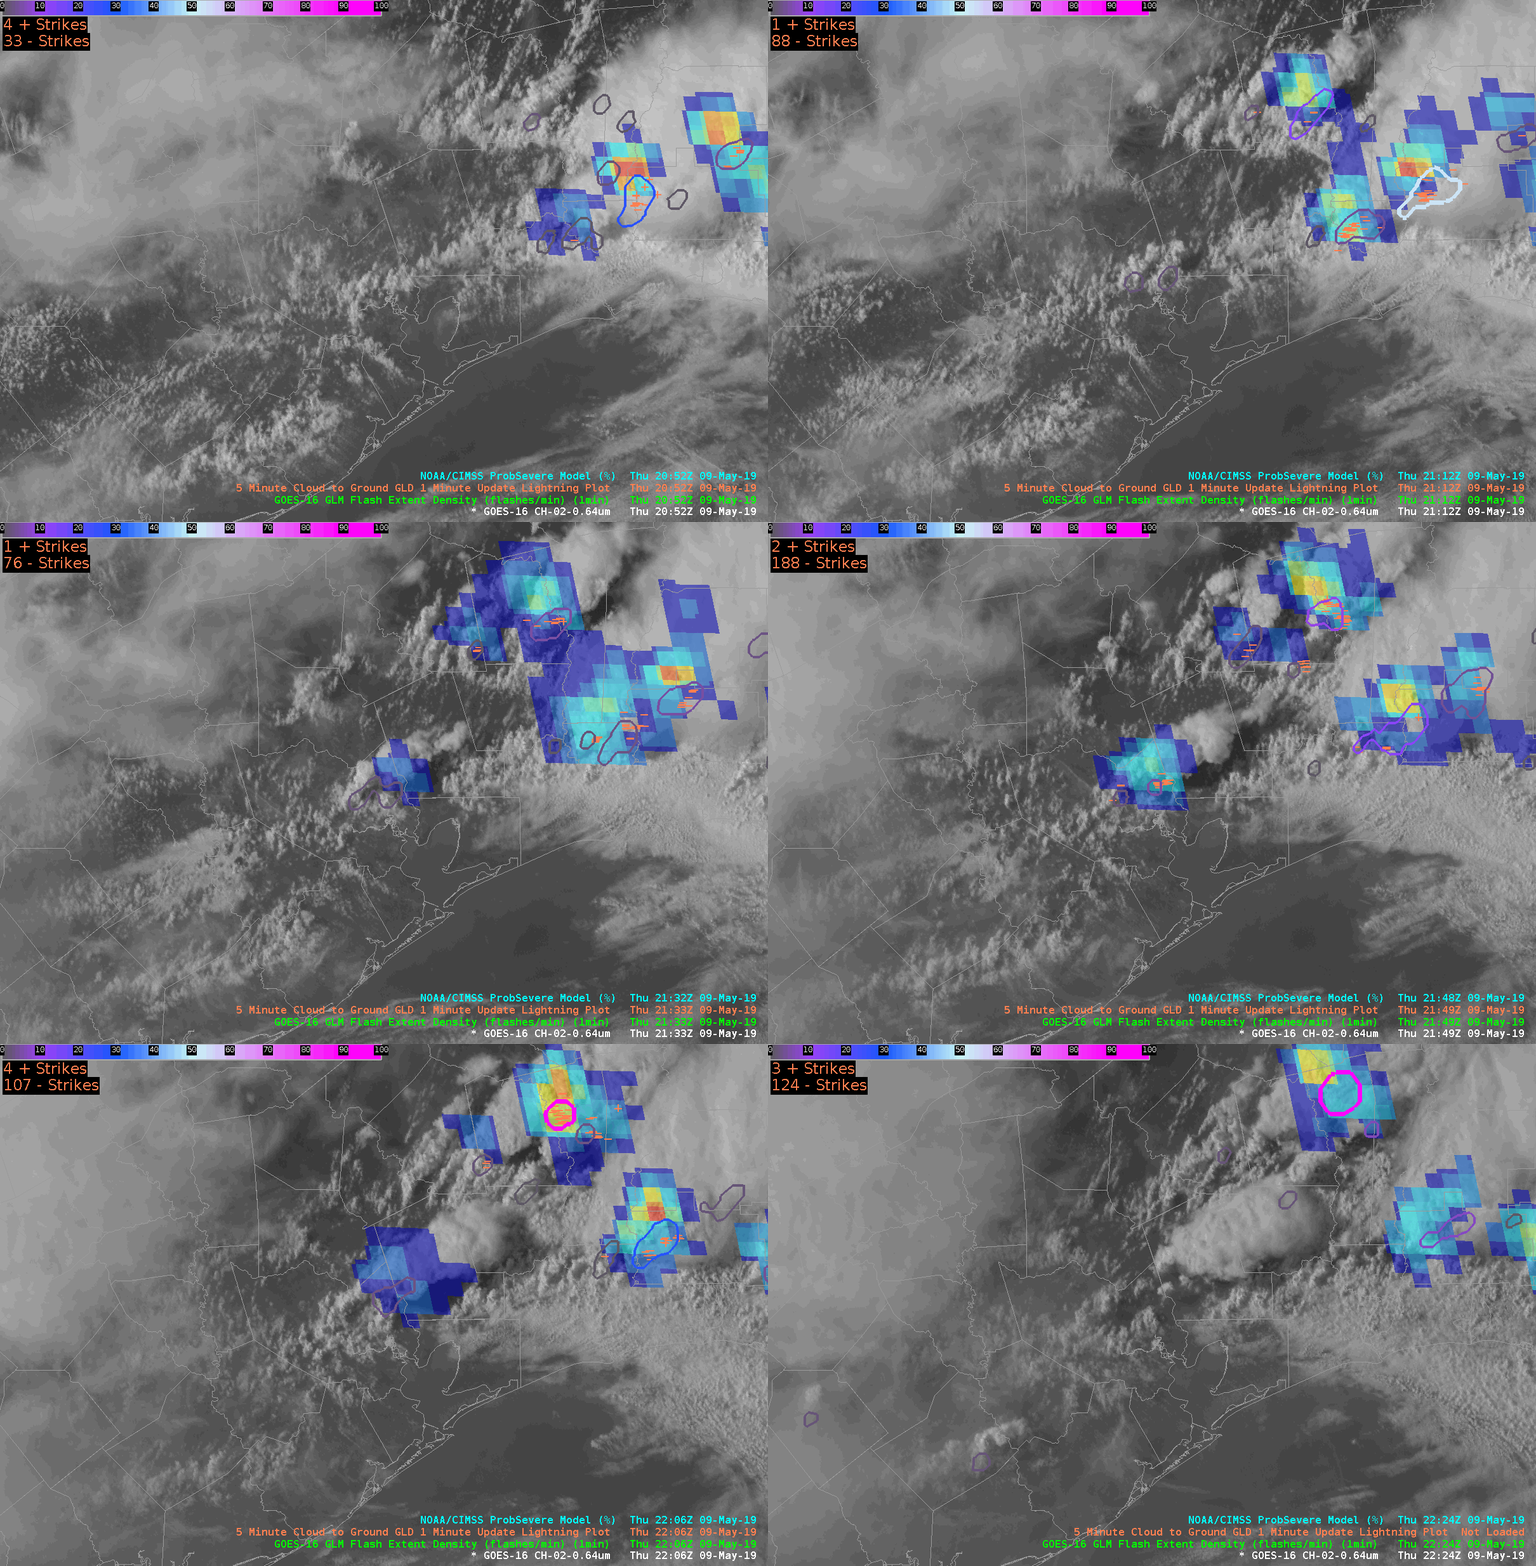
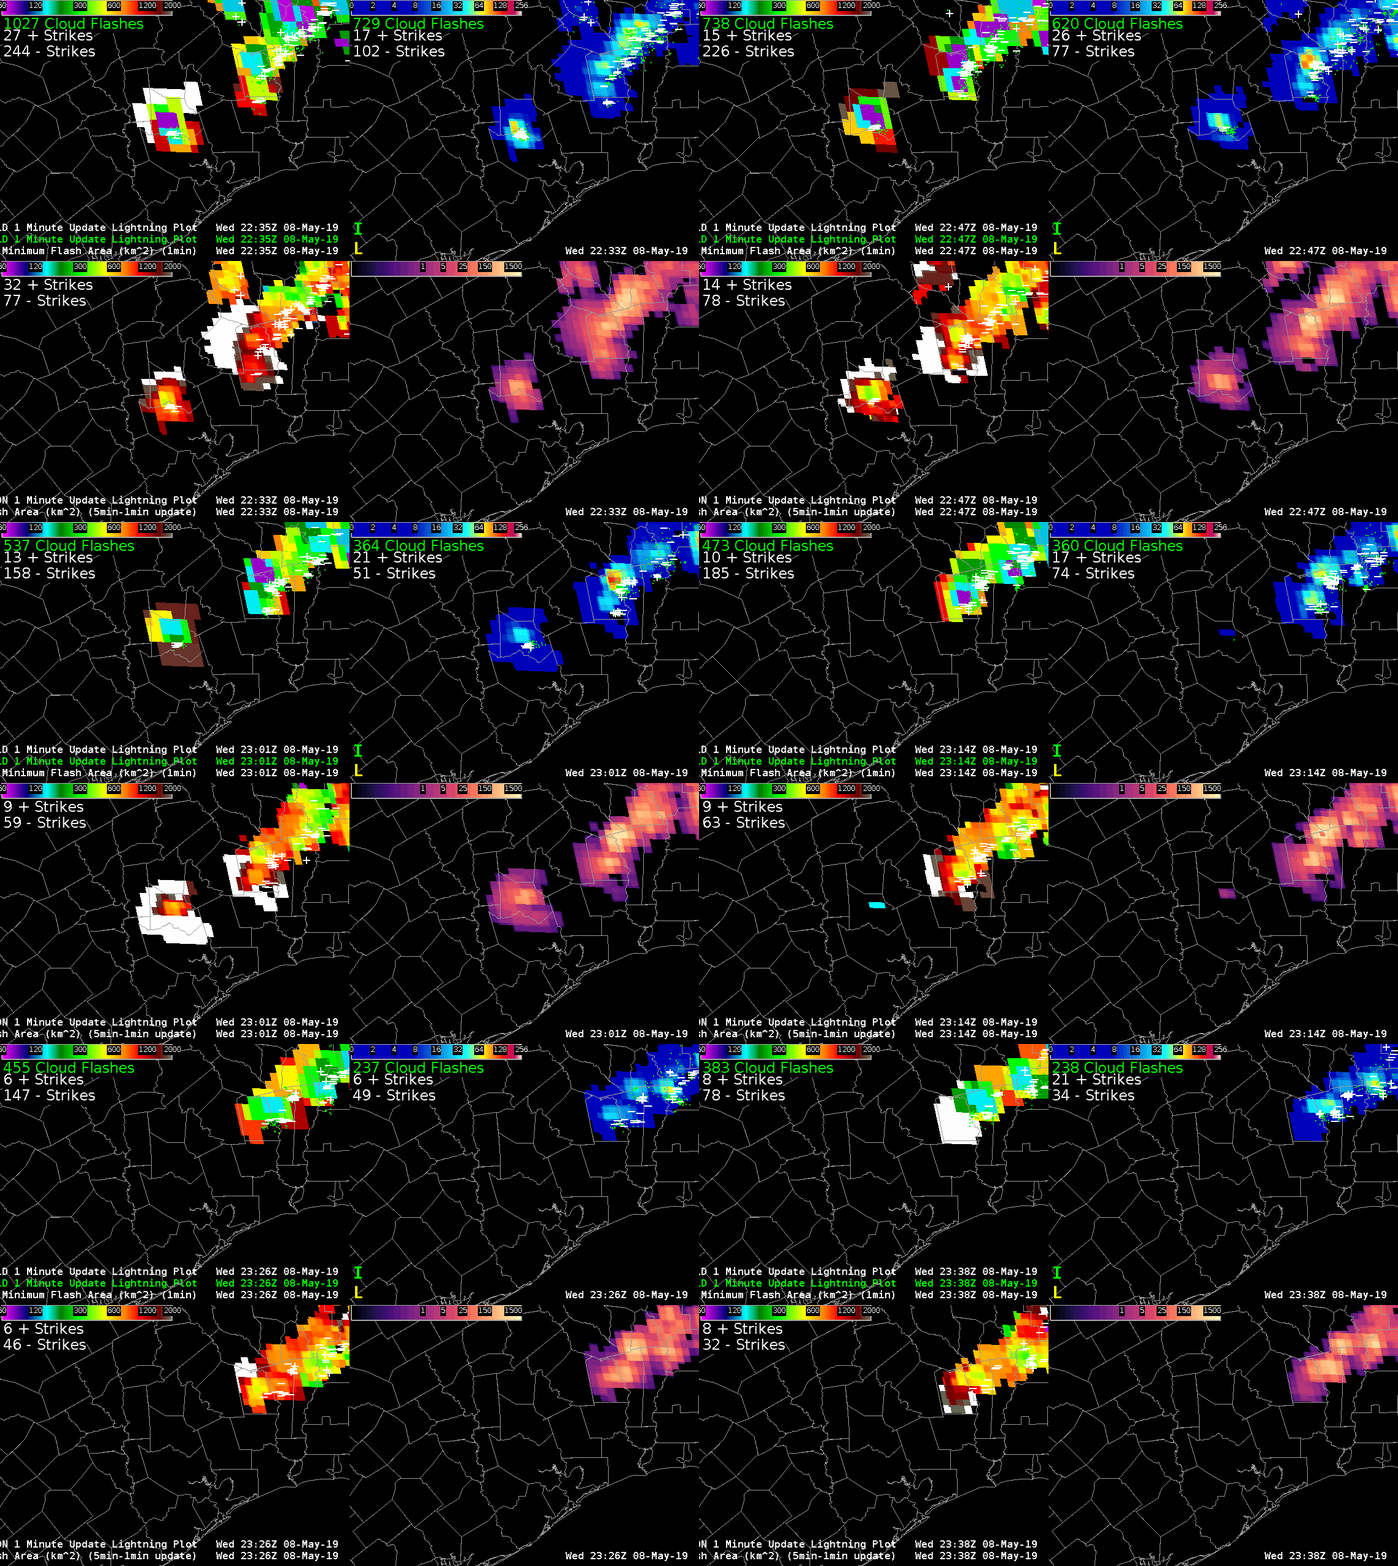
Well, the convection is trying. And dying.  Case in point, the full life cycle of a pair of storms across the  northern suburubs of Houston.  Thoughts below:

You are looking at the 1-minute Mesoscale Sector scan with GLM Flash Extent Density, the Vaisala GLD dataset, and ProbSevere overlays.  Some things to look at:

ProbSevere struggled when the storms were most intense by merging two individual storm objects, splitting them apart, then re-merging back into one object.  Trends were a mess because of this.

GLM lightning activity ceased a full 10 minutes before ProbSevere dissipated the tracking associated with the cells.  However, it continued to show flashes taking place for 7-minutes after the last CG was detected in the GLD data.  Good use for IDSS to let people know that cloud-to-ground strikes are still possible.

The storms initially were moving northwest along a boundary then deviated to the northeast as they strengthened.  As soon as the moved off the boundary…bye bye!

-Dusty

Downward Trend in ProbSevere Time Series & GLM Results in Warning Cancellation

A noted downward trend in the ProbSevere Time series along with a downward trend in the GLM products (not pictured) resulted in this warning forecaster to cancel a SVR for Kerr County early. This early cancellation may not have occurred had these products not been available, potentially leading to areas being unnecessarily warned for a longer amount of time.


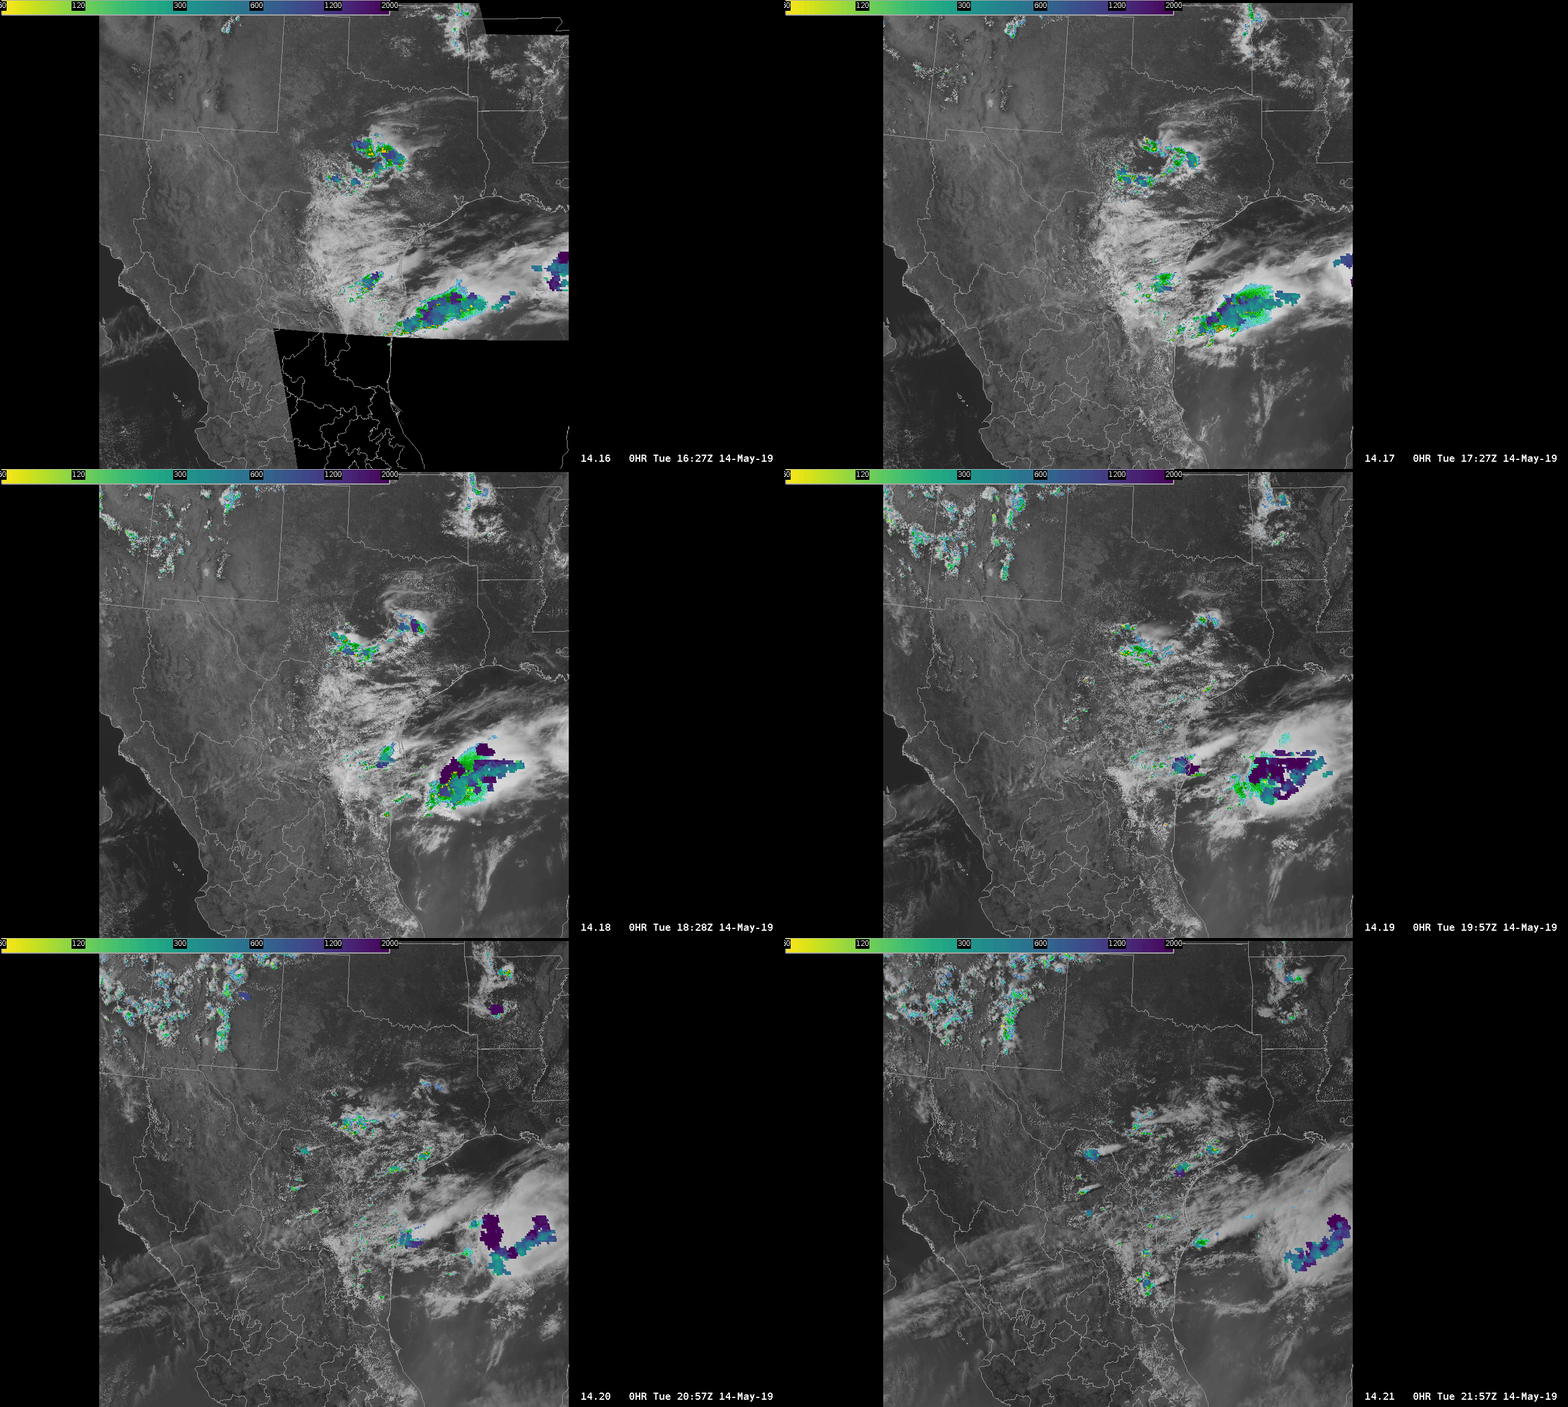
Minimum Flash Area Shows all the Features

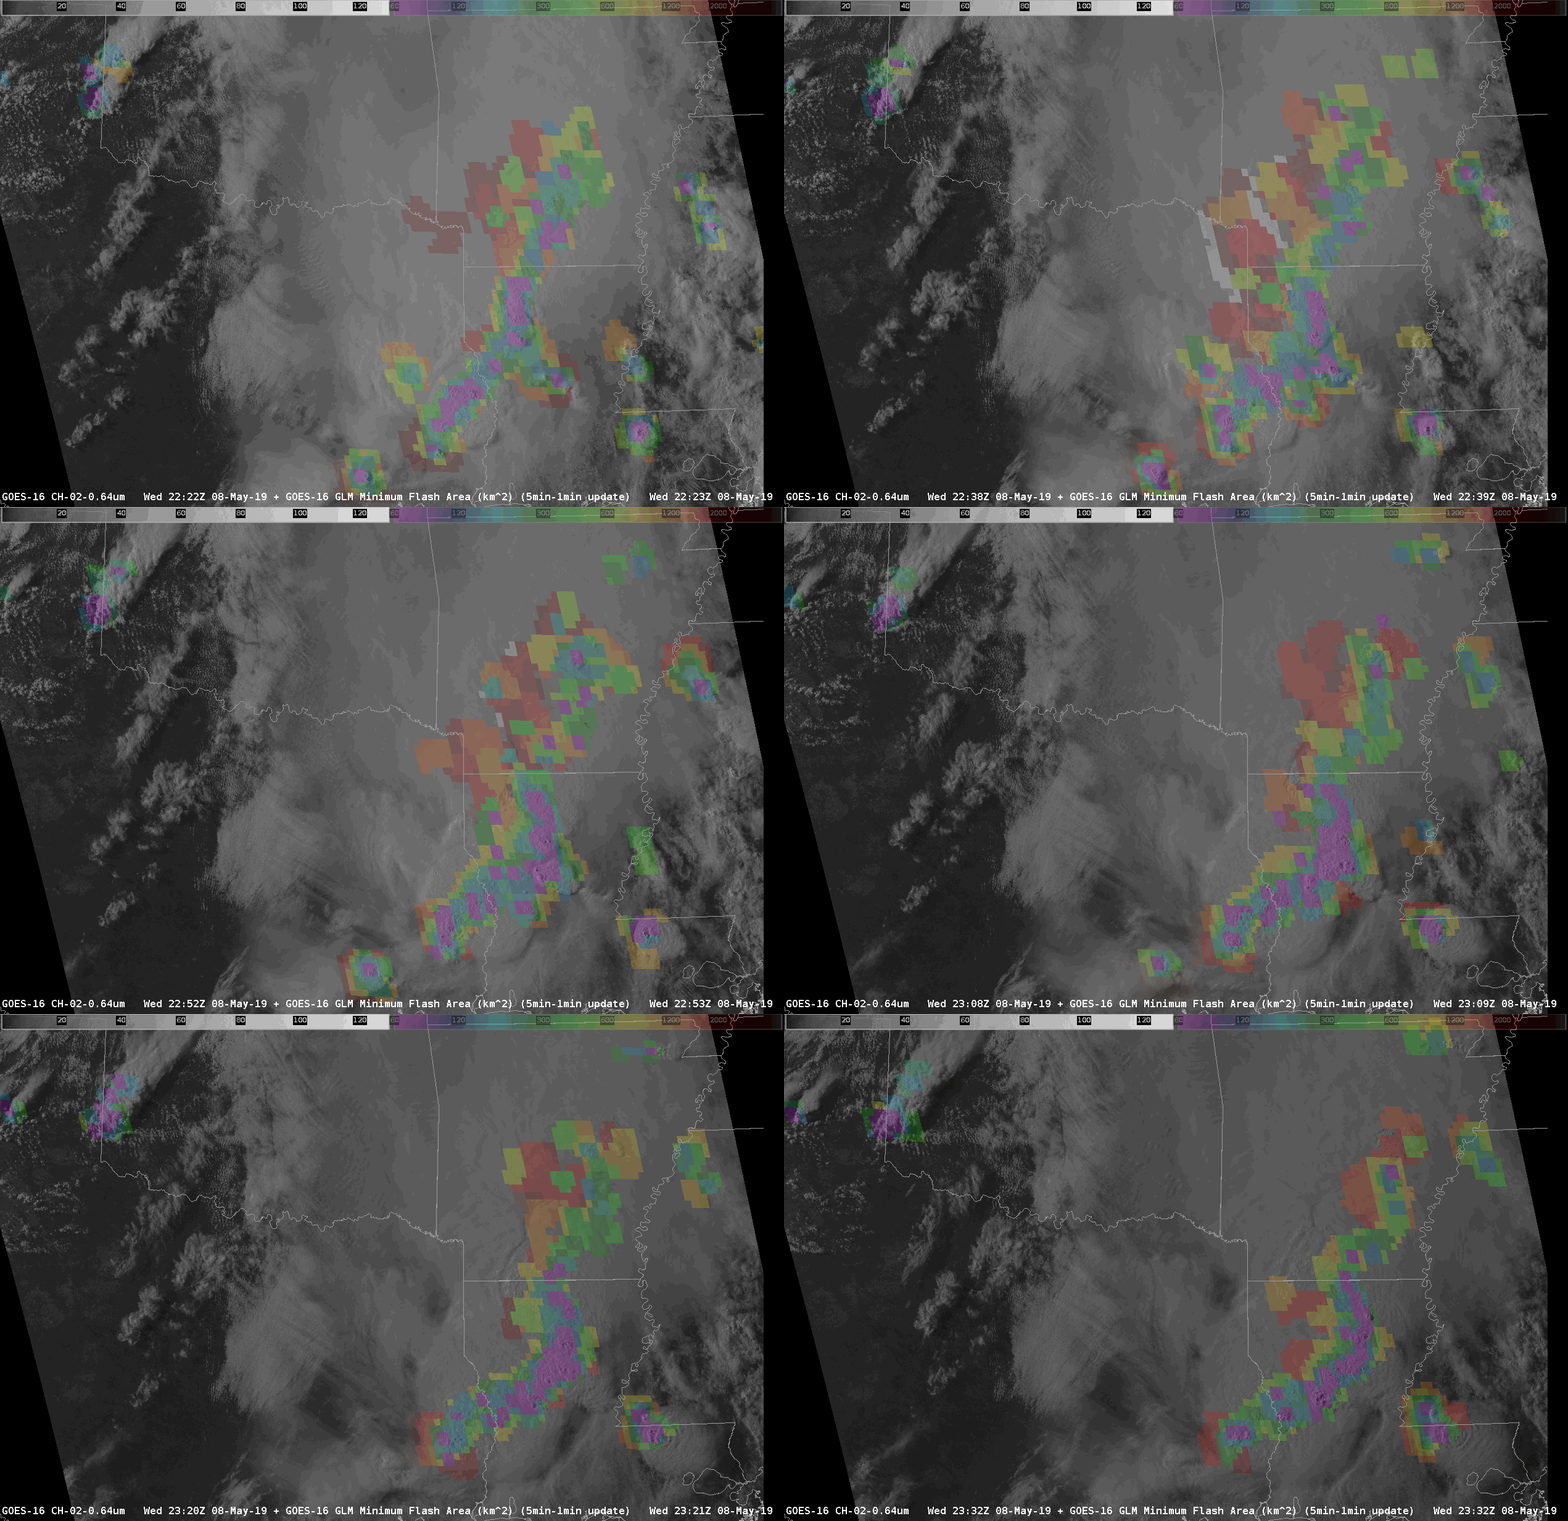
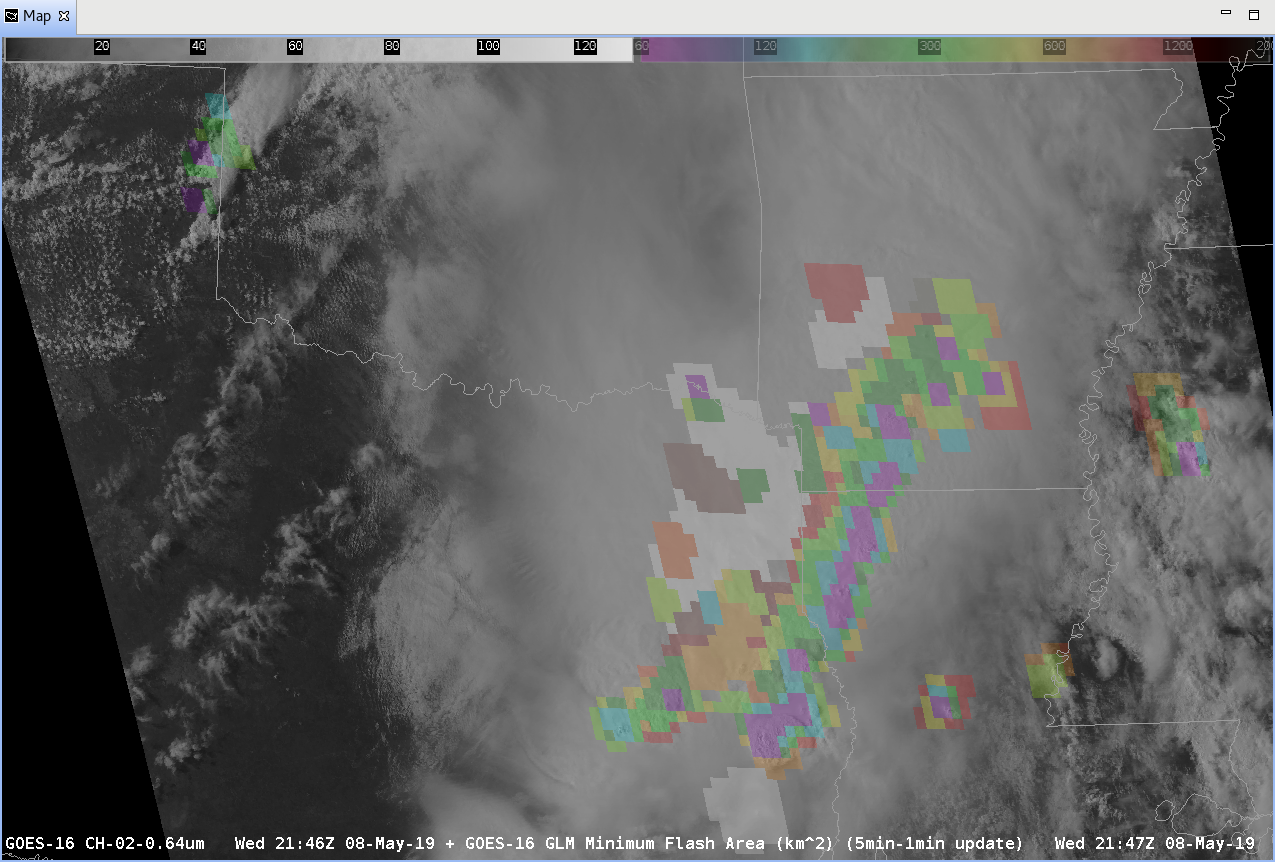
As we move towards sunset, the MCS continues to munch across the southeast Tejas, Louisiana, and portions of Arkansas.  There is alos a strong storm developing ahead of the MCS in SE Louisiana.  Add in some storms across Northwest OK and there is whole spectrum of flash sizes is showing up now:

What is neat about this image is that the small flashes (purple) are concentrated near the overshooting tops of the storms.  The  large area flashes (red to white) are in the trailing stratiform area.

One other cool tidbit I just saw in this loop; watch the southwestern part of the line where a storm weakens and dissipates; flash area basically shows that all electrical activity ceases along with the storm.  Looking closer:

-Dusty

Scale (and color table choice) is Everything

Big flashes taking place in the stratiform region of the departing MCS across the eastern third of Texas.  A LOT of big flashes:

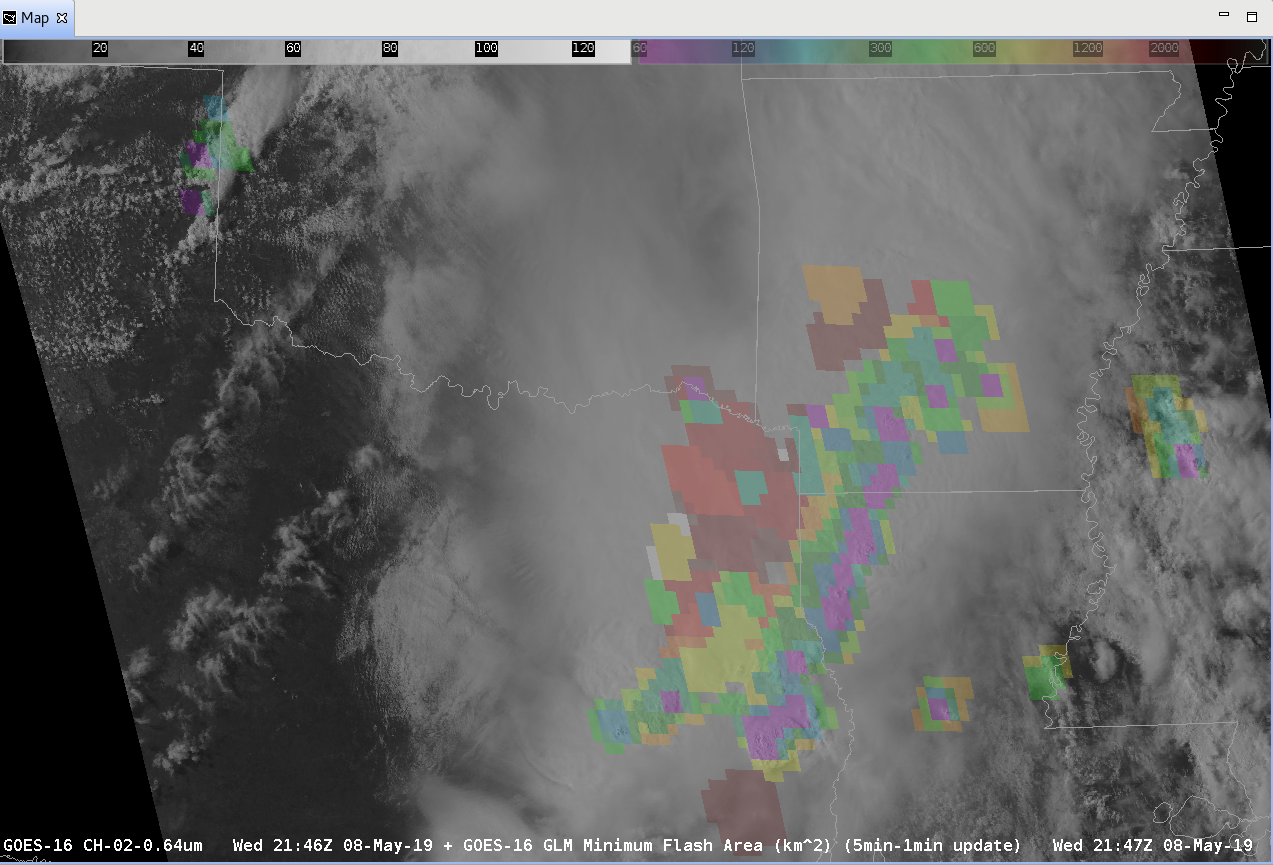
But that doesn’t tell the full story; there are a LOT of big flashes but they are being masked by the scaling of Flash Area.  Right now the scale runs from 64 km2 to 2000 km2.  What happens if we bump that max side up to 4000 km2?

There we go, a bit better discrimination on the big-side of the scale!  It may be hard to see but there is one “white” flash in there; a slightly larger 4600 km2 flash southeast of DFW.

That. is. Yuuuuuuuuuuge.

So, lesson of the day; check the values of flash size (or any flash component).  See if there are values past the end of the current color scale.  Right click on the appropriate product, select Change Colormap , and bump that up some.  May be able to pull out a bit more information than what comes as the default.  Once again however…YMMV.

-Dusty

Lightning Jumps in Action

The storm near Tulia is…impressive.  Aside from being a long-tracked supercell, the storm has been extremely active electrically.  There have been several lightning jumps with this storm that appears to coincide with an increase in the strength of the mid-level mesocyclone.  First we will take a look at an hour long loop (TL – Flash Extent Density overlay with Vaisala GLD, TR – Minimum Flash Area, BL –  Optical Energy, BR –  Mid-level Azimuthal Shear (3-6 km AGL) with New Mesocyclone Detection Algorithm Overlay) :

There are two jumps to take a look at, 1) between 21:29 and 21:40, 2) 21:55 – 21:20.  Although the AzShear product doesn’t show a strong mid-level meso developing, the number of positive CG flashes in the GLD data increases and we see continued small area flashes in the core.  The more impressive jump is the second one;  AzShear shows a much more pronounced area of positive shear, a long-lived NMDA indication (the circle with 4 pips on it), and overall smaller flashes in the area of that storm.

Shortly after the last jump (and not shown here), live stormchaser feeds showed a rapid strengthening of low-level features; well defined wall cloud, organized rotation, and frequent CG activity sending a flurry of stormchasers heading east to get out from under the storm…

-Dusty