The MRMS-FLASH system, running in a real-time demonstration mode for several years now, performed admirably for the recent flash flooding events in Oklahoma and Texas. The MRMS-FLASH system runs in a completely automated fashion ingesting quantitative precipitation estimates every 5-minutes from the MRMS mosaic of NEXRAD data. The FLASH hydrologic modeling system subsequently produces 6-hour forecast hydrographs for everywhere across the CONUS.
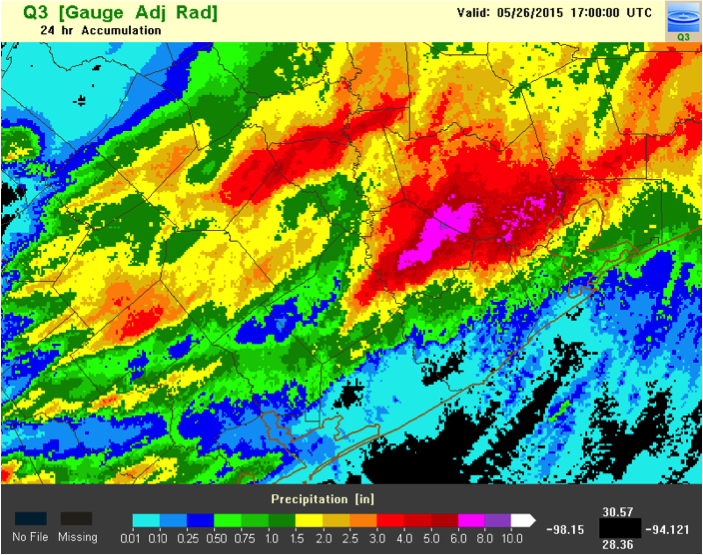
On evening of May 25th, 2015 the city of Houston, Texas experienced a serious flash flooding event. MRMS precipitation estimates indicate that the western portions of the city experienced 6-8″ of rainfall.
MRMS QPE for May 25th, 2015 Houston Flash Flood
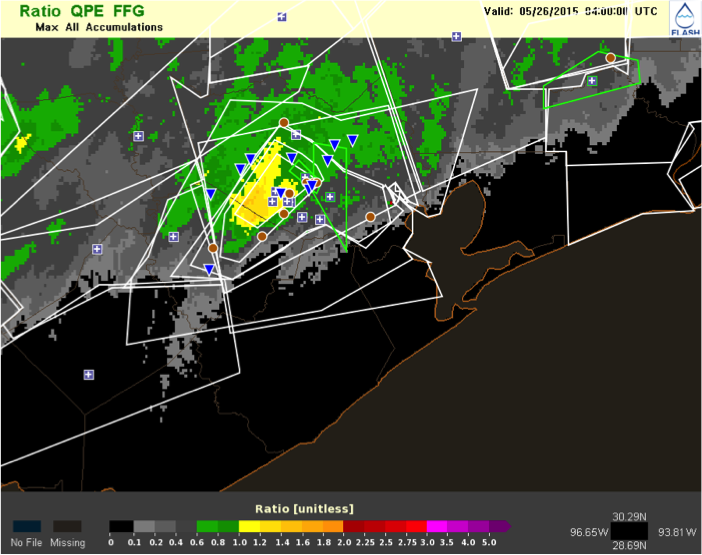
The ratio of precipitation to flash flood guidance shows exceedance values of 100-140% over this area, however some of the USGS stream gauges reporting flash flooding (blue triangles) and the flash flood local storm reports (brown circles) fall outside of this region. This product is important because it is equivalent to the main tool operational NWS forecasters have available for flash flood monitoring and prediction.
MRMS QPE to FFG Ratio for the May 25th, 2015 Houston flash flood. Blue triangles are USGS stream gauges reported flash flooding, brown circles are NWS flash flood local storm reports.
The Coupled Routing and Excess Storage (CREST) distributed hydrologic model, a part of the MRMS-FLASH hydrologic modeling suite, generates maps of streamflow and unit streamflow (cubic meters per second per square kilometer) every 15 minutes. Comparisons between the observations of flash flooding and the maps of unit streamflow show a good correspondence between areas of high unit streamflows and flash flooding.
Animation of unit streamflow from the May 25th, 2015 Houston Flash Flood. Blue triangles are USGS stream gauges reported flash flooding, brown circles are NWS flash flood local storm reports.
The MRMS-FLASH suite of hydrologic models are able to correctly identify areas of flash flooding thanks to the incorporation of
Elizabeth Mintmire Argyle received the Student Presentation Award from the 10th Symposium on Societal Applications, held as a part of the 2015 AMS Annual Meeting in Phoenix, AZ in January 2015, for her oral presentation “Forecaster ‘Best Practices’ During Operations in the Hazardous Weather Testbed Hydrology Experiment 2014.” As part of the recognition, Ms. Argyle received a $200 cash award and a certificate from the American Meteorological Society. Ms. Argyle works as a Graduate Research Assistant for the Cooperative Institute for Mesoscale Meteorological Studies at NOAA’s National Severe Storms Laboratory, in Norman, OK. She is also a PhD candidate in Industrial and Systems Engineering at the University of Oklahoma. Her PhD advisors are Dr. JJ Gourley (NOAA/NSSL), Dr. Ziho Kang (OU), and Dr. Randa Shehab (OU). Funding for Ms. Argyle’s research was provided by NOAA/OAR/Office of Weather and Air Quality (OWAQ) under the NOAA cooperative agreement, NA11OAR4320072.
Zac Flamig and Race Clark received awards at the 95th Annual Meeting of the American Meteorological Society in Phoenix, AZ in January 2015. The awards were selected by the 31st Environmental Information Processing Technologies (EIPT) & the 5th Transition of Research to Operations (R2O) Conference Committees.
Mr. Flamig’s poster, entitled “HWT-Hydro: Evaluation of Experimental Forecast and Nowcast Tools” was selected as a 3rd Place Winner – Poster Presentation Category in the Joint EIPT-R2O Conferences Student Competition. Mr. Clark’s oral presentation, entitled “The Inaugural Hazardous Weather Testbed – Hydrology (HWT-Hydro) Experiment” was the 3rd Place Winner – Oral Presentation Category of the Joint EIPT-R2O Conferences Student Competition. Each will receive a $100 award and a Certificate of Appreciation. Both Mr. Flamig and Mr. Clark are currently PhD candidates at the University of Oklahoma’s School of Meteorology. Each works as a Graduate Research Assistant for the Cooperative Institute for Mesoscale Meteorological Studies at NOAA’s National Severe Storms Laboratory. Their PhD advisors are Dr. JJ Gourley (NOAA/NSSL) and Dr. Yang Hong (OU).
The FLASH project was heavily represented at the various conferences of the 95th Annual AMS Meeting. In addition to Mr. Flamig and Mr. Clark, Dr. JJ Gourley presented an evaluation of flash flood products from the FLASH project, Ms. Elizabeth Argyle presented on forecaster “best practices” during the HWT-Hydro Experiment, and Mr. Brandon Smith presented on observations collected in support of the HWT-Hydro Experiment. Funding for the research presented at the AMS meeting was provided by NOAA/OAR/Office of Weather and Air Quality (OWAQ) under the NOAA cooperative agreement, NA11OAR4320072.
Published: December 23, 2014 by CRC Press Radar Hydrology: Principles, Models, and Applications provides graduate students, operational forecasters, and researchers with a theoretical framework and practical knowledge of radar precipitation estimation. The only text on the market solely devoted to radar hydrology, this comprehensive reference:
Begins with a brief introduction to radar
Focuses on the processing of radar data to arrive at accurate estimates of rainfall
Addresses advanced radar sensing principles and applications
Covers radar technologies for observing each component of the hydrologic cycle
Examines state-of-the-art hydrologic models and their inputs, parameters, state variables, calibration procedures, and outputs
Discusses contemporary approaches in data assimilation
Concludes with methods, case studies, and prediction system design
Includes downloadable MATLAB® content
Flooding is the #1 weather-related natural disaster worldwide. Radar Hydrology: Principles, Models, and Applications aids in understanding the physical systems and detection tools, as well as designing prediction systems.
Editorial Reviews
“This is the first book on radar hydrology written by hydrologists. Whereas the excellent knowledge of radar technology by the authors permits an adequate coverage of the principles of rainfall rate estimation by radar, their hydrological background allows them to provide a unique message on the benefits (and on the remaining challenges) in exploiting radar techniques in hydrology. … In a clear and concise manner, the book combines topics from different scientific disciplines into a unified approach aiming to guide the reader through the requirements, strengths, and pitfalls of the application of radar technology in hydrology—mostly for flood prediction. Chapters include excellent discussion of theory, data analysis, and applications, along with several cross references for further review and useful conclusions.”
The final report on the inaugural Hazardous Weather Testbed Hydro experiment has been released. The report details how the experiment was run, configuration details for AWIPS2, conclusions from the experiment and recommendations for future iterations of the experiment. Thanks again to all of our participants!
After 4 weeks the inaugural HWT-Hydro Experiment has come to a close. During the month of July, we welcomed 17 total participants from NWS offices across the United States. Both the participants and the experiment coordinators took every opportunity to share ideas and knowledge in an effort to improve communication between the research and operational portions of the weather enterprise. Our weekly “Tales from the Testbed” webinars were well-attended, averaging between 20 and 30 remote NWS offices each week. Many of us have made plans to stay in touch and some of us will see each other again as soon as the NWS Flash Flood Summit in September, when the conversation about flash flood observations, forecasting, and modeling will broaden to include all of the National Weather Service’s partners across the US. We recommend watching this space for further news about this year’s experiment, including preliminary results. An overview of the experiment will be presented at the National Weather Association’s annual meeting in Salt Lake City, UT in October. The FLASH research group has also submitted five HWT-Hydro-related abstracts to the 2015 AMS Annual Meeting which will be held in Phoenix, AZ in January.
Now let’s look back at the people who made the last four weeks possible. Thank you all!
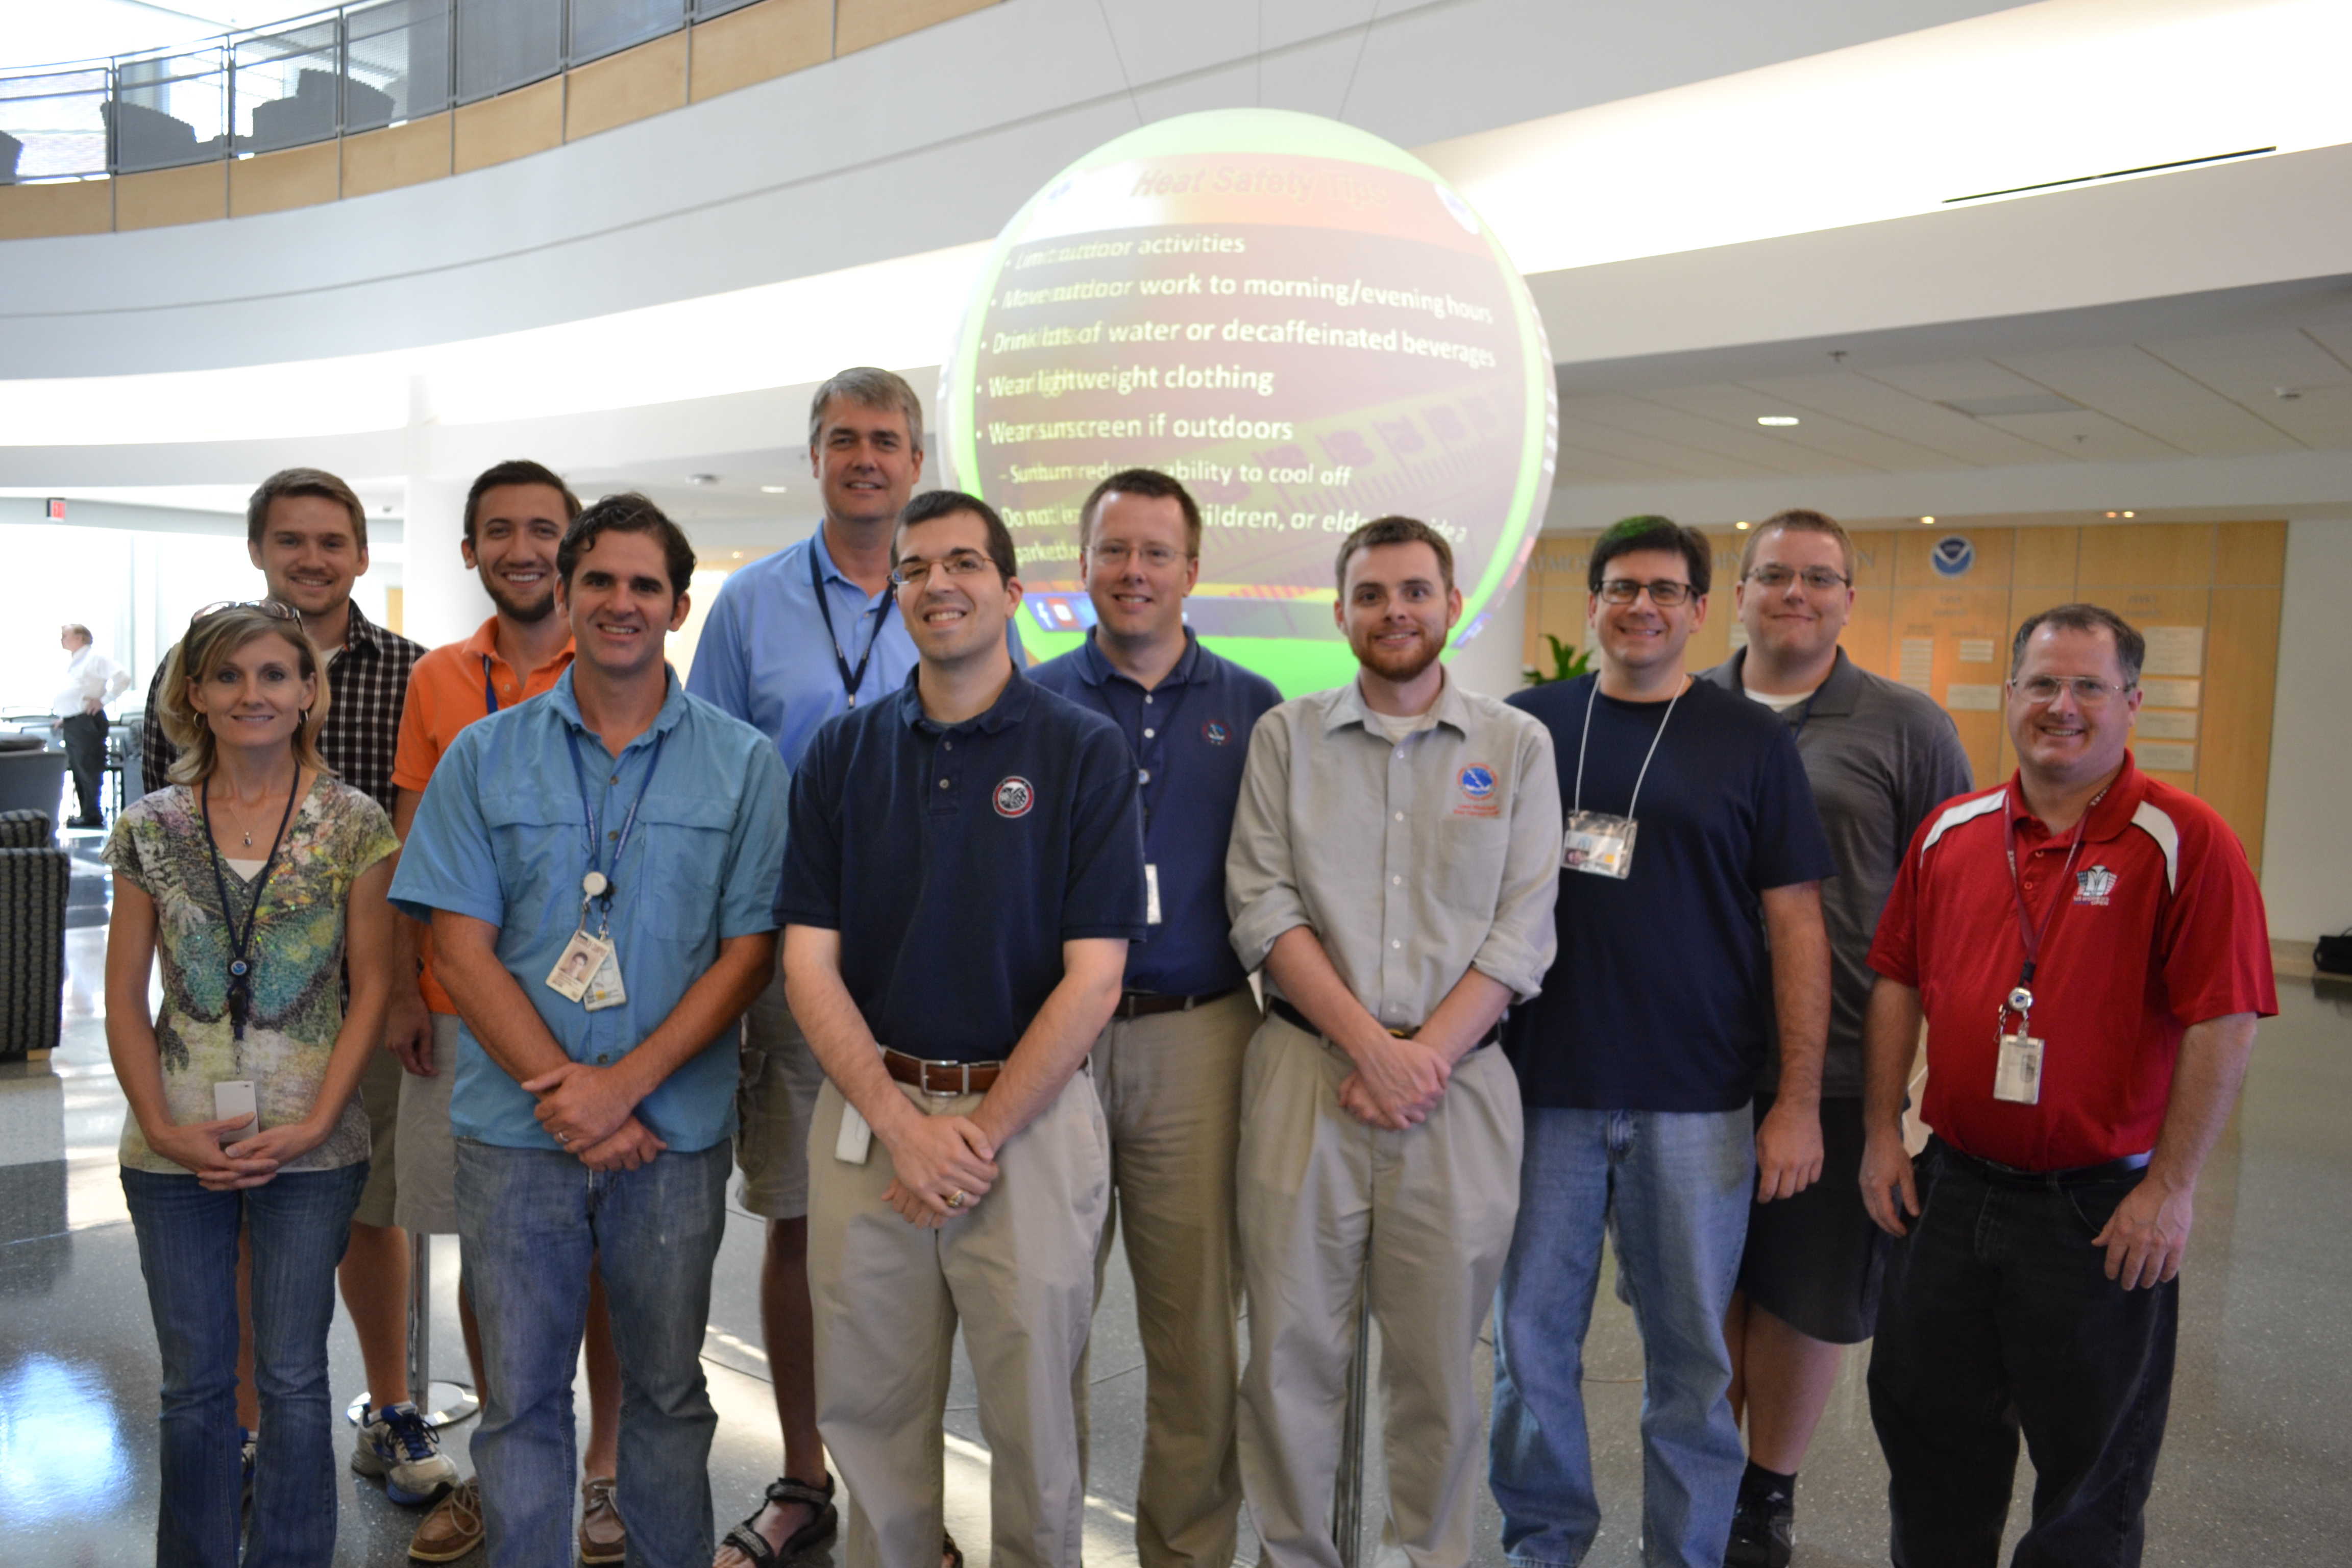
Week 1 participants and staff (L to R, back row): Brandon, David, Chris, Steve, Zac, Jess, and Elizabeth; (L to R, front row): Jonathan, Mike, and RaceWeek 2 participants and staff (L to R): Steve, Brandon, Race, Britt, Laura, Amanda, Zac, and JessWeek 3 participants and staff (L to R): Ami, Brandon, Race, J.J., Greg, Steve, Jeff, Scott L., Scott W., Zac, and TonyWeek 4 participants and staff (L to R): Steve, Tom, Brandon, Jess, Chris, Elizabeth, Jennifer, J.J., Race, Zac, and Ray
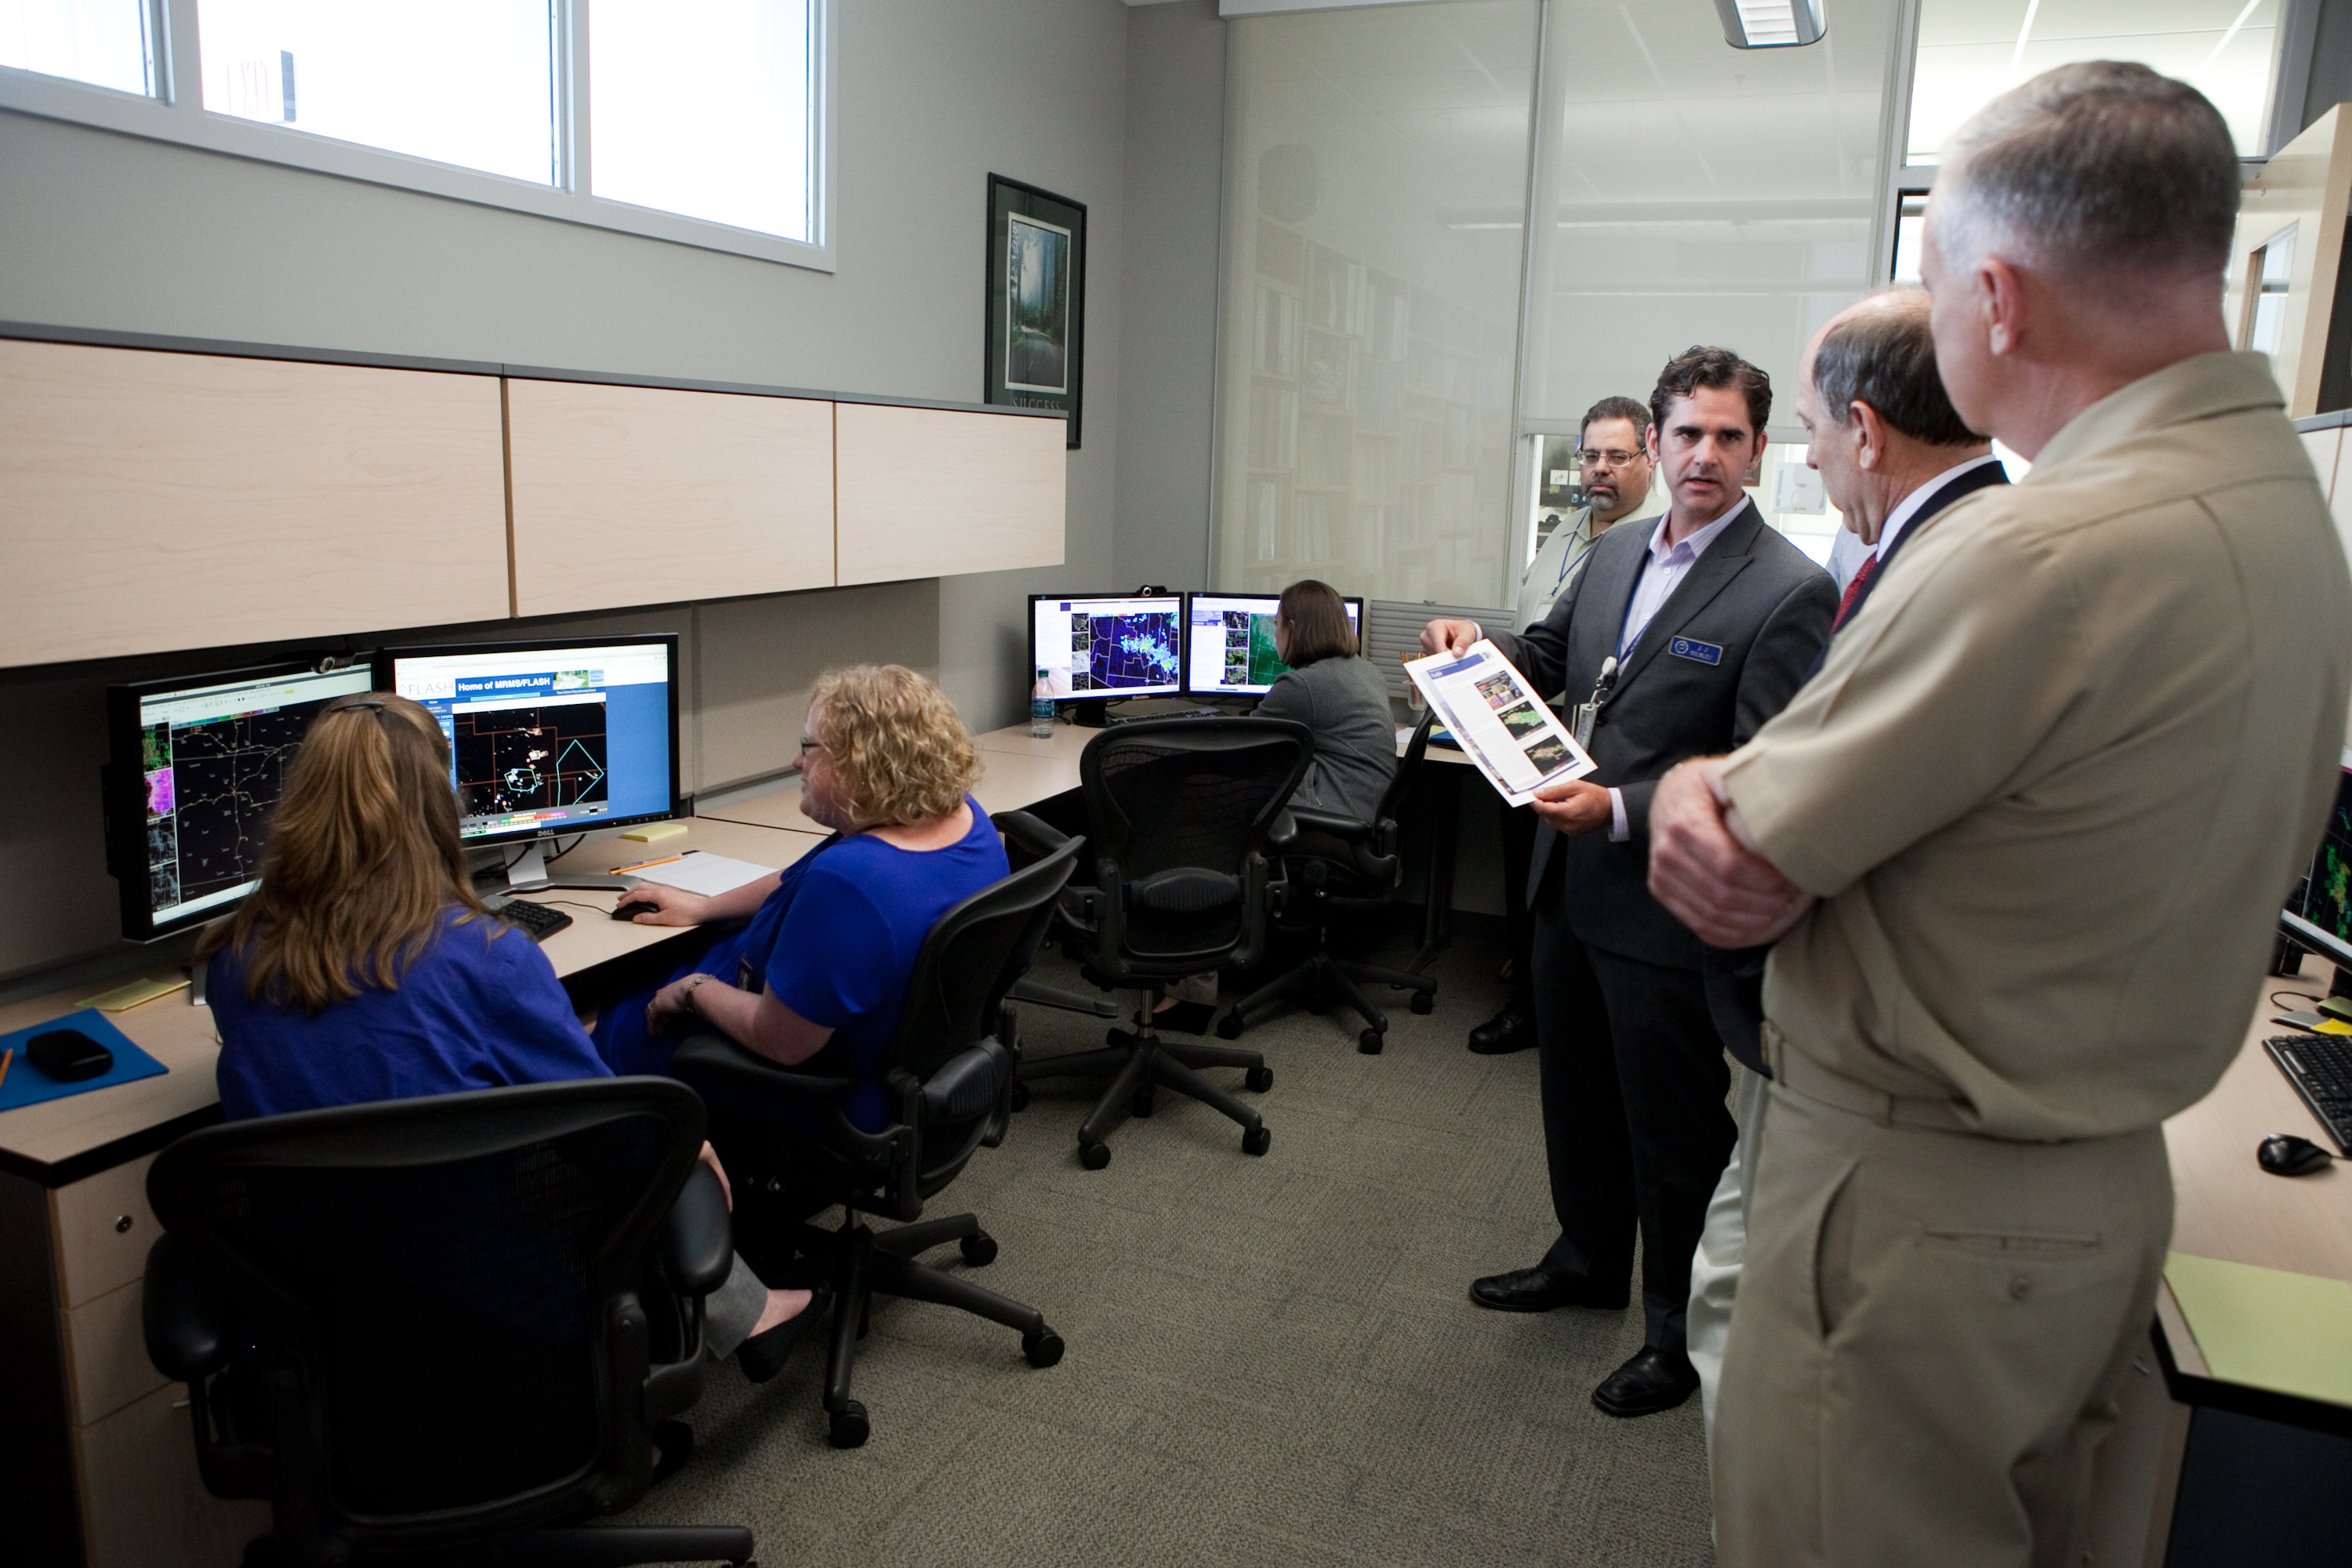
Dr. JJ Gourley explains the HWT-Hydro experiment to NWS Director Dr. Louis Uccellini and NOAA Deputy Under Secretary Vice Adm. Michael Devany
On Wednesday, July 16, 2014, HWT-Hydro received a visit from NOAA Deputy Under Secretary Vice Adm. Michael S. Devany and National Weather Service Director Dr. Louis W. Uccellini. They were visiting Norman to see how research-to-operations (R2O) activities are conducted within the various NOAA units housed in the National Weather Center. Both officials discussed the ongoing efforts to align research activities at NSSL with the operational needs of the NWS. Dr. Uccellini described methods of easing the eventual R2O transition of the FLASH suite of forecast tools with the experiment’s principal investigator, Dr. JJ Gourley. Dr. Gourley also took the opportunity to explain how the various components of the FLASH product suite work in unison to give forecasters a view of heavy precipitation and flooding issues. Vice Adm. Devany and Dr. Uccellini visited during the middle of an experimental forecasting shift, where week 2 HWT-Hydro participants were monitoring potential flash flooding impacts in the High Plains and the Intermountain West. Week 2 participants are Britt Westergard (NWS Albany NY), Laura Belanger (NWS Peachtree City GA), Amanda Schroeder (NWS Fort Worth TX), and Jeff Waldstreicher (NWS Eastern Region).
One of the most intractable problems facing those who issue flash flood warnings and watches is verification. The term “flash flooding” means different things to different people, so observing these events is distinct from, say, observing a tornado. Most people immediately know what a tornado is but do you immediately know what a flash flood is? It’s okay if you answered “no”! We recognize that different strategies exist for locating and classifying flash floods. In an effort to be as comprehensive as possible, the HWT-Hydro experiment is including observations from several distinct sources.
USGS Stream Gauges
Automated systems can provide useful information in these situations. USGS stream gauges automatically measure stream height (or “stage”) at over 16,000 sites across the United States every 15 minutes. At these sites, cross sectional information about the river channel is known and so these stage measurements can be converted into stream flow estimates. Additionally, the USGS and its partner agencies know enough about these locations to estimate the relative rarity (or “return period) of a particular flow, and at some locations, the National Weather Service has assigned flood stages corresponding to specific impacts at specific stream height levels. On flash.ou.edu, blue triangles mark stream gauge locations where the NWS “Action Stage” stage height has been exceeded by the gauge, the stream height has risen by a significant level in a short period of time, or the USGS estimated 2-year return period flow has been surpassed. These USGS observations are being fed to the FLASH system and the HWT-Hydro experiment by our partners at the NCEP Weather Prediction Center’s FFaIR experiment. The downside of USGS observations should already be clear: what happens if there’s a flood in an ungauged location? The answer to this question means we must seek out additional sources of information.
Local Storm Reports
The NWS operates 122 Weather Forecast Offices across the country, each of which is responsible for a set of counties, parishes, or boroughs. These offices issue flash flood watches and warnings as necessary. They also collect reports of flash flooding and other phenomena (called Local Storm Reports, or LSRs) because as forecasters, they have a vested interest in determining if a given watch or warning was successfully verified by on-the-ground conditions. So if they don’t receive reports volunteered by the public, broadcasters, social media, or local government officials, they will call known sources inside a watch or warning until they determine if flooding actually occurred. The NWS is responsible for the whole US so the LSRs should be nearly comprehensive but there are caveats to this: many areas with low or no population density will lack appropriate LSRs and in areas where no warning is issued there still could have been flash flooding. Outside of these warning polygons, if no one bothers to report impacts to their local NWS office no LSR will be issued. On the flash.ou.edu website, LSRs are represented by reddish-brown circles. They can be moused over to see the date and time at which the report was issued (in UTC) as well as the text describing the nature of the flash flooding impact.
Example of LSR from south-central Tennessee for the evening of 8 July 2014
mPING
Some folks may experience flash flooding but can’t, don’t know how, or don’t want to report this via phone to local officials or to their local NWS office. However, as smartphones proliferate, useful weather information can be garnered via crowd sourcing. One of the leading projects in this field was developed at the National Severe Storms Laboratory and the University of Oklahoma — mPING. mPING allows geolocated smartphone owners to report the type of precipitation or severe weather impact (including flash flooding) occurring at their location. This data is used by scientists at OU and NSSL, as well as NWS forecasters and others. All reports can be accessed via the mPING website and flash flooding reports in particular can be accessed via the FLASH website, where they appear as purple equilateral triangles. A report of flash flooding can fall into one of four possible impact classes in the mPING app, ranging from nuisance and minor flooding all the way up to deadly or damaging flooding. Remember, safety comes first when using mPING. Never drive into flooded roadways or walk into floodwaters! The free mPING app is available for iOS devices and Android devices from the Apple App Store or the Google Play Store, respectively.
SHAVE
One final source of observations is unique to the HWT-Hydro project. As part of the support provided to the program by the US Weather Research Program, we have hired two callers to work as part of NSSL’s 2014 SHAVE project. As our forecast participants and other guests issue experimental watches and warnings each afternoon and evening, SHAVE callers will use a national database of landline telephone numbers mapped to addresses to call people residing within and near these experimental products and give them telephone surveys about flash flooding impacts in and near their areas. These reports thus provide an extremely dense storm focused set of observations. On flash.ou.edu, SHAVE reports will appear as small squares. Those surveys where the respondent reported no flash flooding will appear in gray. Respondents reporting flash flooding will appear in blue.
Verification
Early each afternoon, HWT-Hydro participants will look back at the products they issued the afternoon before. They will evaluate the skill and usefulness of forecast tools and the utility of the various types of observations described above. Yesterday our forecasters split into two areas: one pair focused on Tennessee, Arkansas, and the surrounding area, while the other pair worked in the Desert Southwest with the ongoing monsoon.
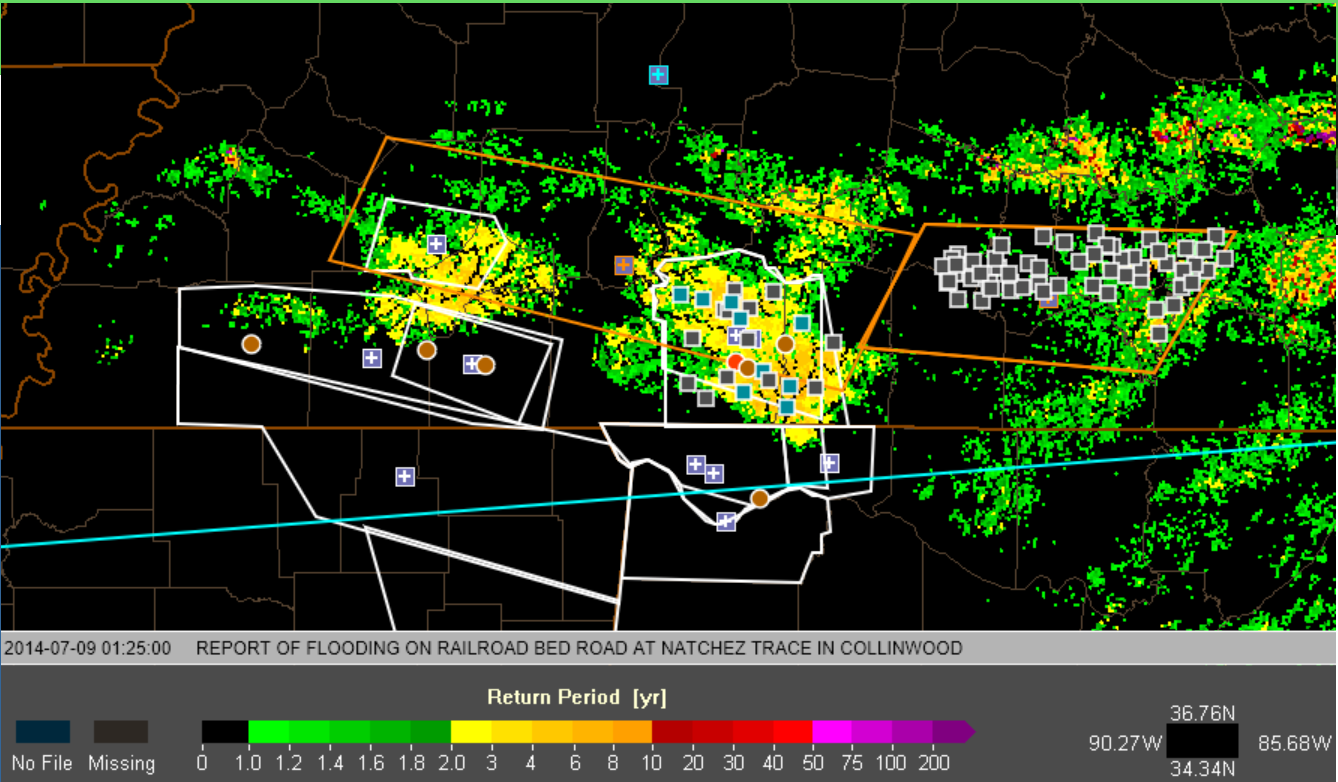
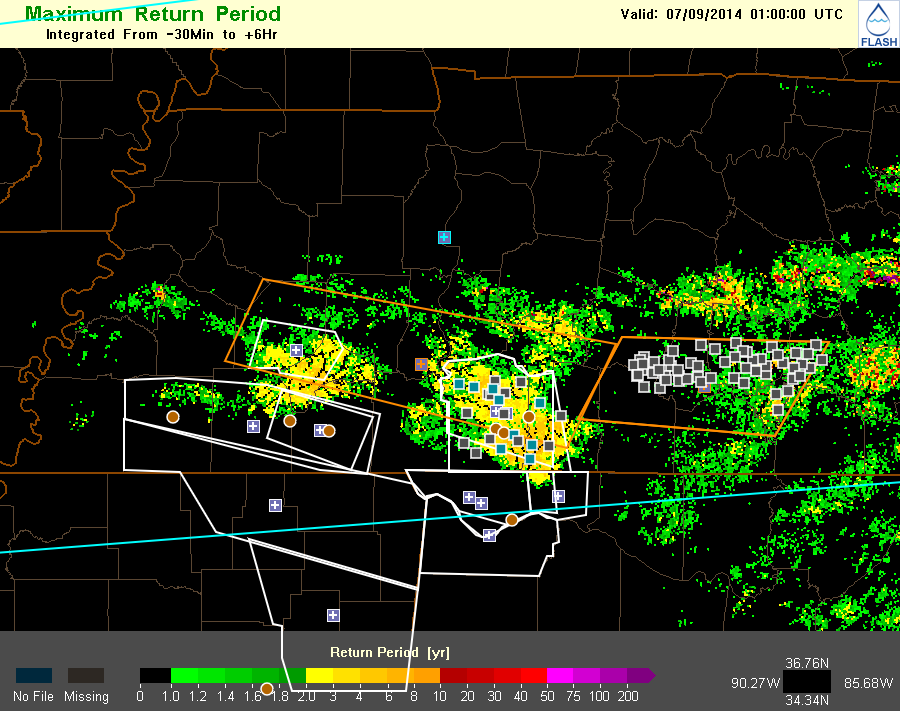
Evaluation (valid 8 PM CDT on July 8) of FLASH Max Return Period product and experimental watches (north of blue line) and warnings (in orange) in western Tennessee. Operational warnings are in white. LSRs are shown by circles and SHAVE reports by squares. Note that our forecasting shift ends at 8 PM before the operational warnings in southern Tennessee would have been necessary. Our forecasters felt great about their experimental watch and the westernmost of the two experimental warnings shown. The Max Return Period product successfully identified the lesser threat in the eastern experimental warning (note that all the SHAVE reports in that box are reports of no flooding).
Verification of 8 July 2014 3-hour precipitation accumulation return period product with the same symbology as above. Note that the LSRs tend to occur within and around operational warnings because these are the areas mostly likely to be called by the forecasters issuing the warnings. SHAVE reports are difficult to come by in the west due to a relative lack of population density and telephone numbers to call!
The inaugural Hazardous Weather Testbed Hydrology (HWT-Hydro) experiment began today at the National Weather Center in Norman OK. This experiment will explore uses of the FLASH suite of flash flood and heavy rainfall products. Participants will be asked to use these products to issue experimental flash flood watches and warnings; these will include information about the likelihood or uncertainty of a given impact as well as the severity of expected impacts. Novel sources of flash flood observations, including the mPING mobile application and SHAVE phone calls, will be used to assess the effectiveness of the experimental tools and the experimental watches and warnings.
Two forecasters a week are participating in the experiment, with funding provided by the US Weather Research Program. This week’s forecasters are Mike Moneypenny (NWS Forecast Office Raleigh NC) and David Ondrejik (NWS Middle Atlantic River Forecast Center). Joining them are guests Chris Legro (NWS Forecast Office Gray ME) and Jonathan Brazzell (NWS Forecast Office Lake Charles LA).
Each day of the experiment will begin with a weather briefing from the Flash Flood and Intense Rainfall Experiment at the NCEP Weather Prediction Center in College Park MD. Then forecasters will spend time evaluating the performance of the experimental forecast tools and observations from the previous day’s shift. Forecasters will then issue flash flood watches and warnings as necessary, typically from 3 PM to 8 PM CDT, Monday through Thursday. This “virtual forecast office” will cover the entire Lower 48.
Today’s areas of focus can be broadly divided into three main components: the summer monsoon in the Desert Southwest, a complex of strong to severe convection in the middle Mississippi River and Ohio River valleys, and rain across the Middle Atlantic into the Northeast. As I type, our forecasters have already issued an experimental watch and two experimental warnings for afternoon storms in the Southwest (see below for these experimental products overlaid on state/national boundaries and 6-hr MRMS rainfall estimates). More frequent updates can be found by following the experiment on Twitter at @HWTHydro.
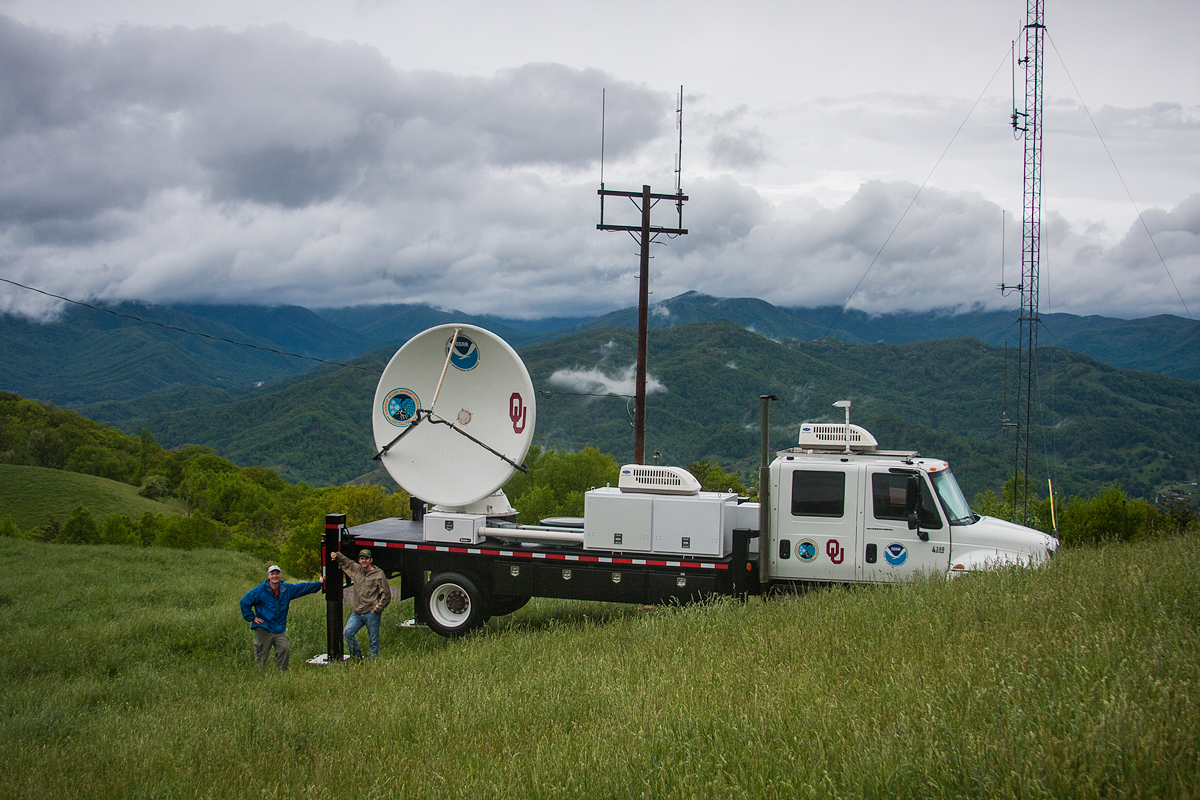
The NSSL NOXP Radar on location for iPHEXMembers of the FLASH team have been involved in the Integrated Precipitation and Hydrology Experiment (IPHEx) to study warm season precipitation and hydrologic response in the complex terrain of western North Carolina. The team has been with NSSL’s NOXP radar to coordinate operations with several other ground-based platforms as well as NASA’s ER-2 and UND’s Citation aircraft. Further, a number of developmental radar-based (MRMS) and hydrologic model-based (FLASH) products are being supplied to the experimental team for research and evaluation. The experiment runs from May 1 – June 15, 2014.

 Published: December 23, 2014 by CRC Press