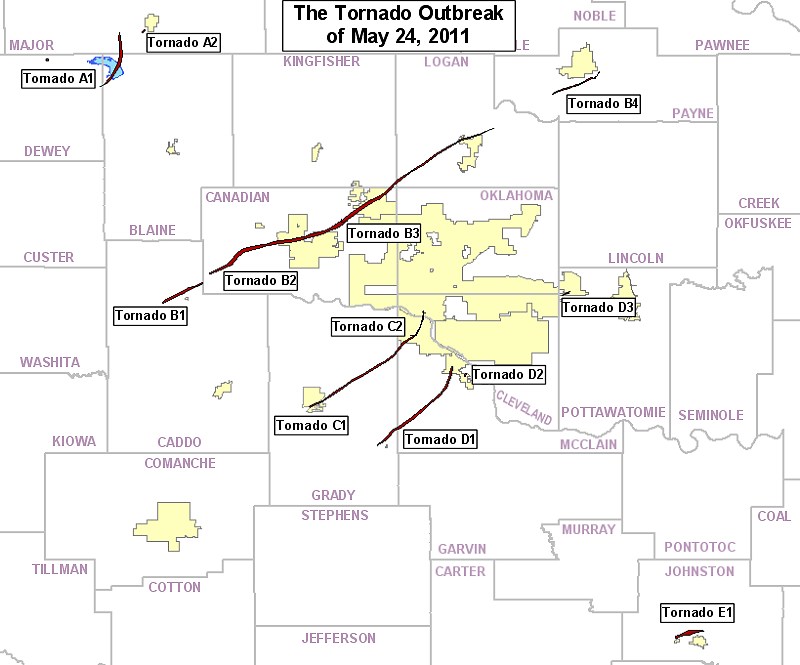
The tornado outbreak forecasted by the NOAA Storm Prediction Center and the National Weather Service Forecast Office in Norman, Oklahoma became a reality as five damage-producing tornadoes struck central Oklahoma between 3 pm and 7 pm CDT May 24, 2011. The longest-track tornado, rated EF3 by the Norman Forecast office, damaged homes and businesses along its 75-mile path that originated just northwest of Binger and moved through the towns of El Reno, Peidmont, and Guthrie (Fig. 1).
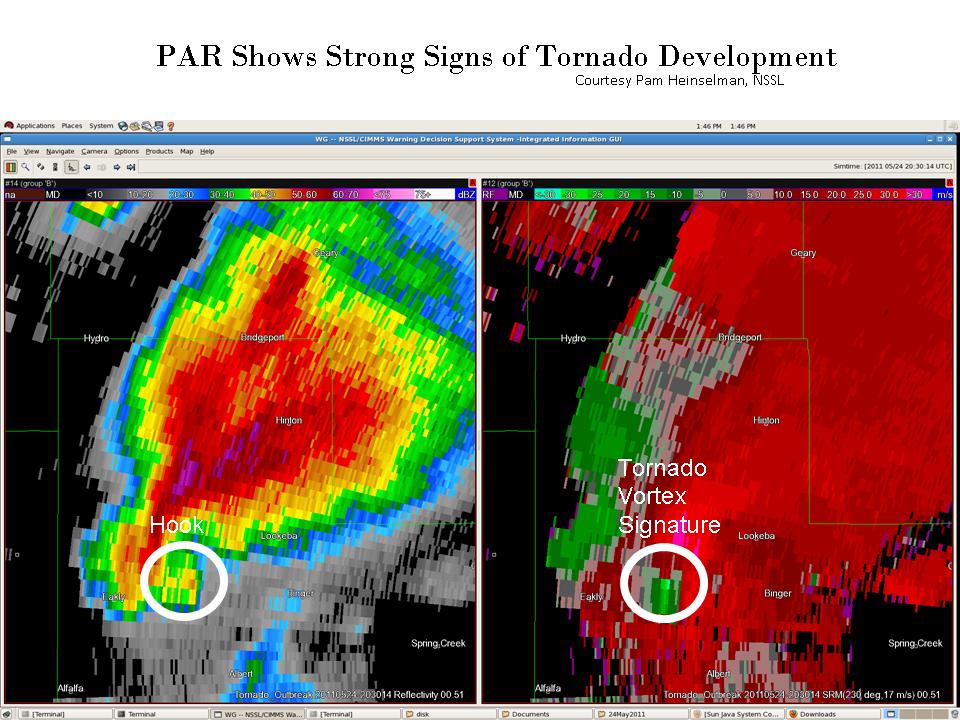
The rapid-scan, S-band phased-array radar (PAR), located within the National Weather Radar Testbed in Norman, Oklahoma, sampled this tornadic supercell every 1 minute. Based on PAR data, by 3:30 pm supercell storm formed its first well-defined hook echo and associated tornado vortex signature about 6 miles west of Binger (TVS; Fig. 2). At this time, PAR data show that the TVS had a maximum gate-to-gate velocity difference of 89 mph. A comparison of PAR velocity data with the damage path shows that the tornado formed about 12 minutes later, at 3:40 pm.
The 1-minute updates of the PAR exhibit many important details about the evolution of this supercell and its long-lived tornado. One example is the hard-right turn of the TVS and hook at 4:15 pm that placed El Reno in the tornado’s destructive path (Fig. 3 ~62 km northeast of PAR). About 10 min later (4:25 pm, west-side of El Reno), as cells approaching from the southeast began to merge with the hook and a new circulation developed, the hook’s motion was redirected to the northeast, toward Piedmont. Fig. 3 also shows the likely development of two “debris” signatures in the radar reflectivity, which are compact regions of high reflectivity values due to debris from the tornado.
This example shows the PAR’s capability to provide timely, detailed information about where a tornadic storm is headed, and its intensity. In the future, this PAR capability may give families the few additional minutes they may need to take cover from destructive storms.


