UPDATE (14-Aug-2012): Graph corrected to indicate 2006 as previous 15 Apr-31 Jul minimum.
The 2012 tornado season in the United States got off to a quick start with well-above average numbers in January, February, and March. Later, over 80 tornadoes occurred on 14 April. Since then, the number of tornadoes in the US has been unusually low. In order to understand how low, we need to look at the long-term history of tornado occurrence. The most reliable portion of the tornado data begins in 1954 but, even after that, we have to be careful in how we interpret it. Since the mid-1950s, the number of tornadoes reported has increased by an average of 14 per year. The increase has been almost entirely in the weakest tornadoes (F0) and is highly likely that the causes are non-meteorological. We can think of this increase in the same way we think of inflation in economics and estimate its impact by adjusting historical tornado counts to account for it. This process, and how it can be applied to part of the year, is discussed here.
That inflation-adjustment process allows us to look at historical data, but a problem still remains of how to look at recent reports. Preliminary, eyewitness reports of tornadoes are collected by local National Weather Service Forecast Offices and the offices then evaluate those reports and produce a list of “final” tornado reports. This process of evaluation takes a few months to complete, so it can be challenging to answer the question “how many tornadoes occurred” shortly after an event. Over the last several years, a simple relationship between the preliminary and final reports has been observed with the number of final reports being approximately 85% of the preliminary reports. As a result, when looking at the preliminary reports in recent months, we can a pretty good estimate of the final reports simply by multiplying the preliminary reports by 0.85.
Let’s look at how many tornadoes we would expect based on the inflation-adjusted tornado count and compare this year’s tornadoes to that long-term expectation. To emphasize the small number of tornadoes since the middle of April, we’ll start on 15 April and add up the number of tornadoes each year through the end of July. In the accompanying chart, we see the distribution of the accumulated number of inflation-adjusted tornadoes as we got from 15 April-31 July. The distribution is based on the period from 1954-2011. The maximum and minimum of any of those years are shown in blue (note that the year associated with the maximum and minimum can change from day to day along the way). The heavy black line is the median of the distribution, the gray lines are the 25th and 75th percentiles (half the years will be between them), and the dashed lines are the 10th and 90th percentiles (4 out of 5 years will be between them). For comparison, the estimated number of final tornado reports from 2012 are shown in red.
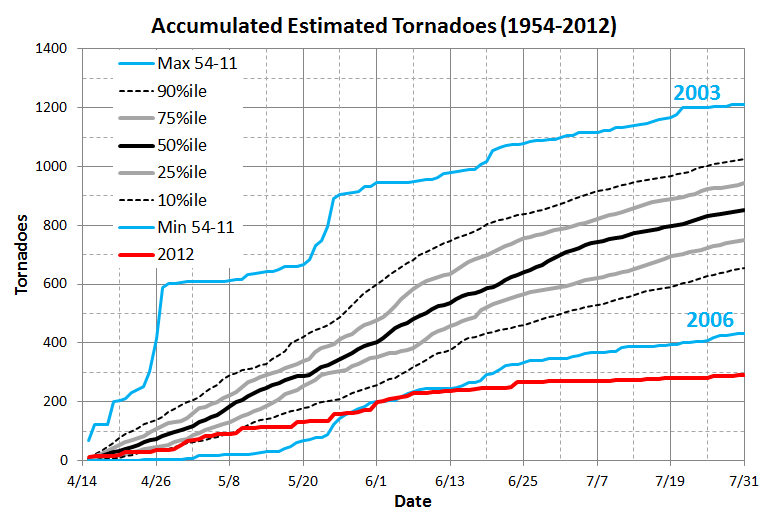
Through the end of May, the tornado count for the period from 2012 goes along at approximately the 10th percentile of the long-term distribution but, after that, falls well below the previous low. To put this into perspective, the estimated number of final reports from June for 2012 is approximately 100. The previous inflation-adjusted low for any previous June is 94 in 1988. (Remember that the blue line represents the fewest number of tornadoes from any of the 58 years from 1954-2011.) The median number of June tornadoes in 1954-2011 was approximately 270.
July was even more remarkable than June. Only 24 preliminary reports were received, leading to an expected number of final reports of a little over 20. The lowest number of inflation-adjusted tornado reports from 1954-2011 is 73 (1960). Even without inflation adjustment, the fewest number of tornadoes in any July in that time period is 42 (1960), emphasizing the extraordinary nature of this July. The median number of July tornado reports is about 150.
When we look at the whole period from 15 April-31 July, the median tornado count in the record is 850, compared to 2012, with a little under 300. The 850 represents almost 2/3 of the usual annual total of about 1300. One way of thinking about the late spring and early summer tornado season is that the atmosphere missed more than 40% of a typical year’s tornadoes in 3 1/2 months. Compared to 2003, the comparable period in 2012 had more than 900 fewer tornadoes. 2011 had the second highest number of tornadoes in this part of the year, so in the last two years, the US has experienced the extreme high end of the distribution of the number of tornadoes and the extreme low end of the distribution.


")
